Fig. A.1
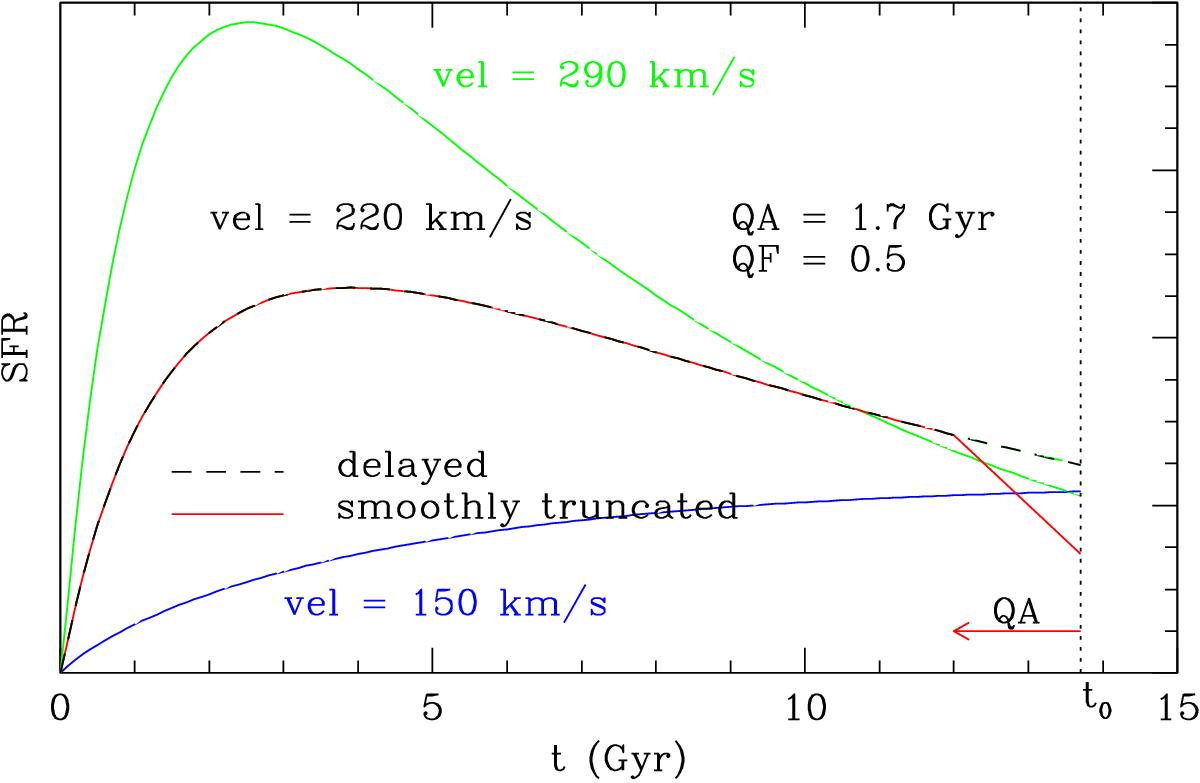
Parametric star formation history for a galaxy with a rotational velocity of 220 km s-1 (black dashed line), 290 km s-1 (green solid line), and 150 km s-1 (blue solid line). The black dashed line shows the delayed star formation history given in Eq. (1), the red solid line the smoothly declining history (Eq. (A.1)) for a galaxy with a rotational velocity of 220 km s-1. This figure can be compared to Fig. 2.
Current usage metrics show cumulative count of Article Views (full-text article views including HTML views, PDF and ePub downloads, according to the available data) and Abstracts Views on Vision4Press platform.
Data correspond to usage on the plateform after 2015. The current usage metrics is available 48-96 hours after online publication and is updated daily on week days.
Initial download of the metrics may take a while.