Fig. 17
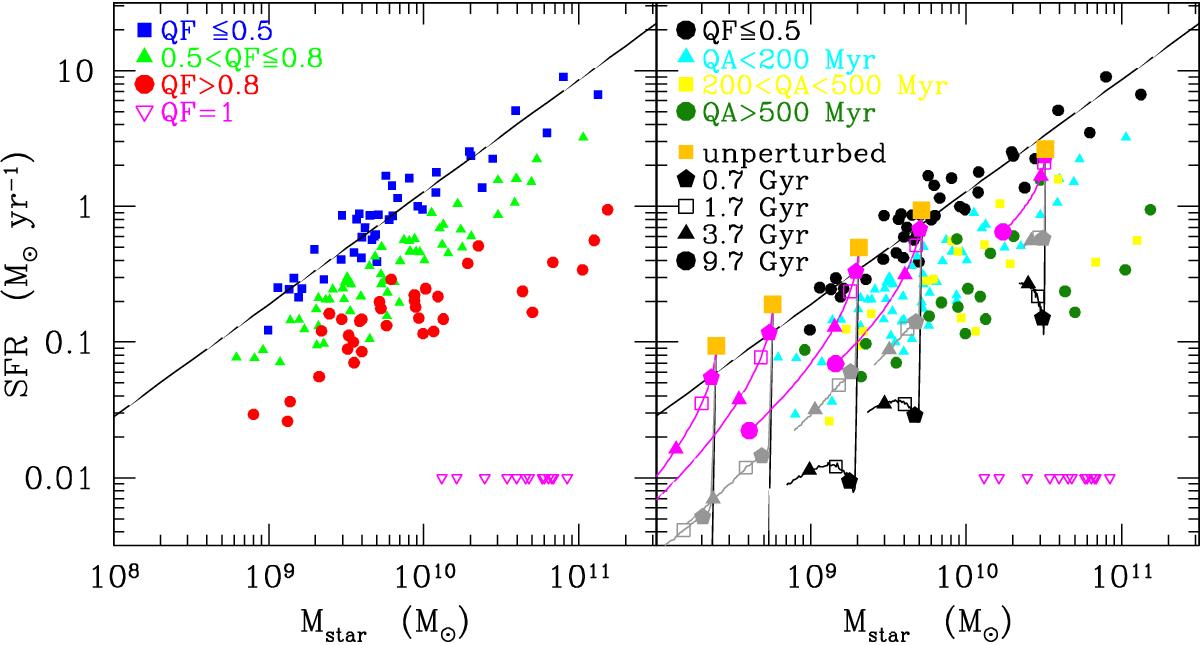
Relationship between the present day star formation rate and the stellar mass (main sequence) derived from the SED fitting code. Left panel: symbols are coded according to the quenching factor of the analysed galaxies. Blue filled squares, green triangles, and red circles are for galaxies where the derived quenching factor is QF ≤ 0.5, 0.5 < QF ≤ 0.8, and QF > 0.8, respectively. Magenta triangles indicate upper limits to the star formation rate of early-type galaxies. The solid line shows the bisector fit to the data for unperturbed galaxies (QF ≤ 0.5). Right panel: same relation with colour symbols coded according to the quenching age. Black filled dots are for unperturbed galaxies (QF ≤ 0.5), cyan triangles, yellow squares, and dark green dots for galaxies with a quenching age QA < 200 Myr, 200 < QA < 500 Myr, and QA > 500 Myr, respectively. The large orange filled squares indicate the models of Boselli et al. (2006; 2014c) for unperturbed galaxies of spin parameter λ = 0.05 and rotational velocity 70, 100, 130, 170, and 220 km s-1. The magenta lines indicate the starvation models. The black and grey lines show the ram-pressure-stripping models for a stripping efficiency ϵ0 = 1.2 M⊙ kpc-2 yr-1 and ϵ0 = 0.4 M⊙ kpc-2 yr-1, respectively. Different symbols in the models indicate the position of the model galaxies at a given look-back time from the beginning of the interaction.
Current usage metrics show cumulative count of Article Views (full-text article views including HTML views, PDF and ePub downloads, according to the available data) and Abstracts Views on Vision4Press platform.
Data correspond to usage on the plateform after 2015. The current usage metrics is available 48-96 hours after online publication and is updated daily on week days.
Initial download of the metrics may take a while.