Fig. 15
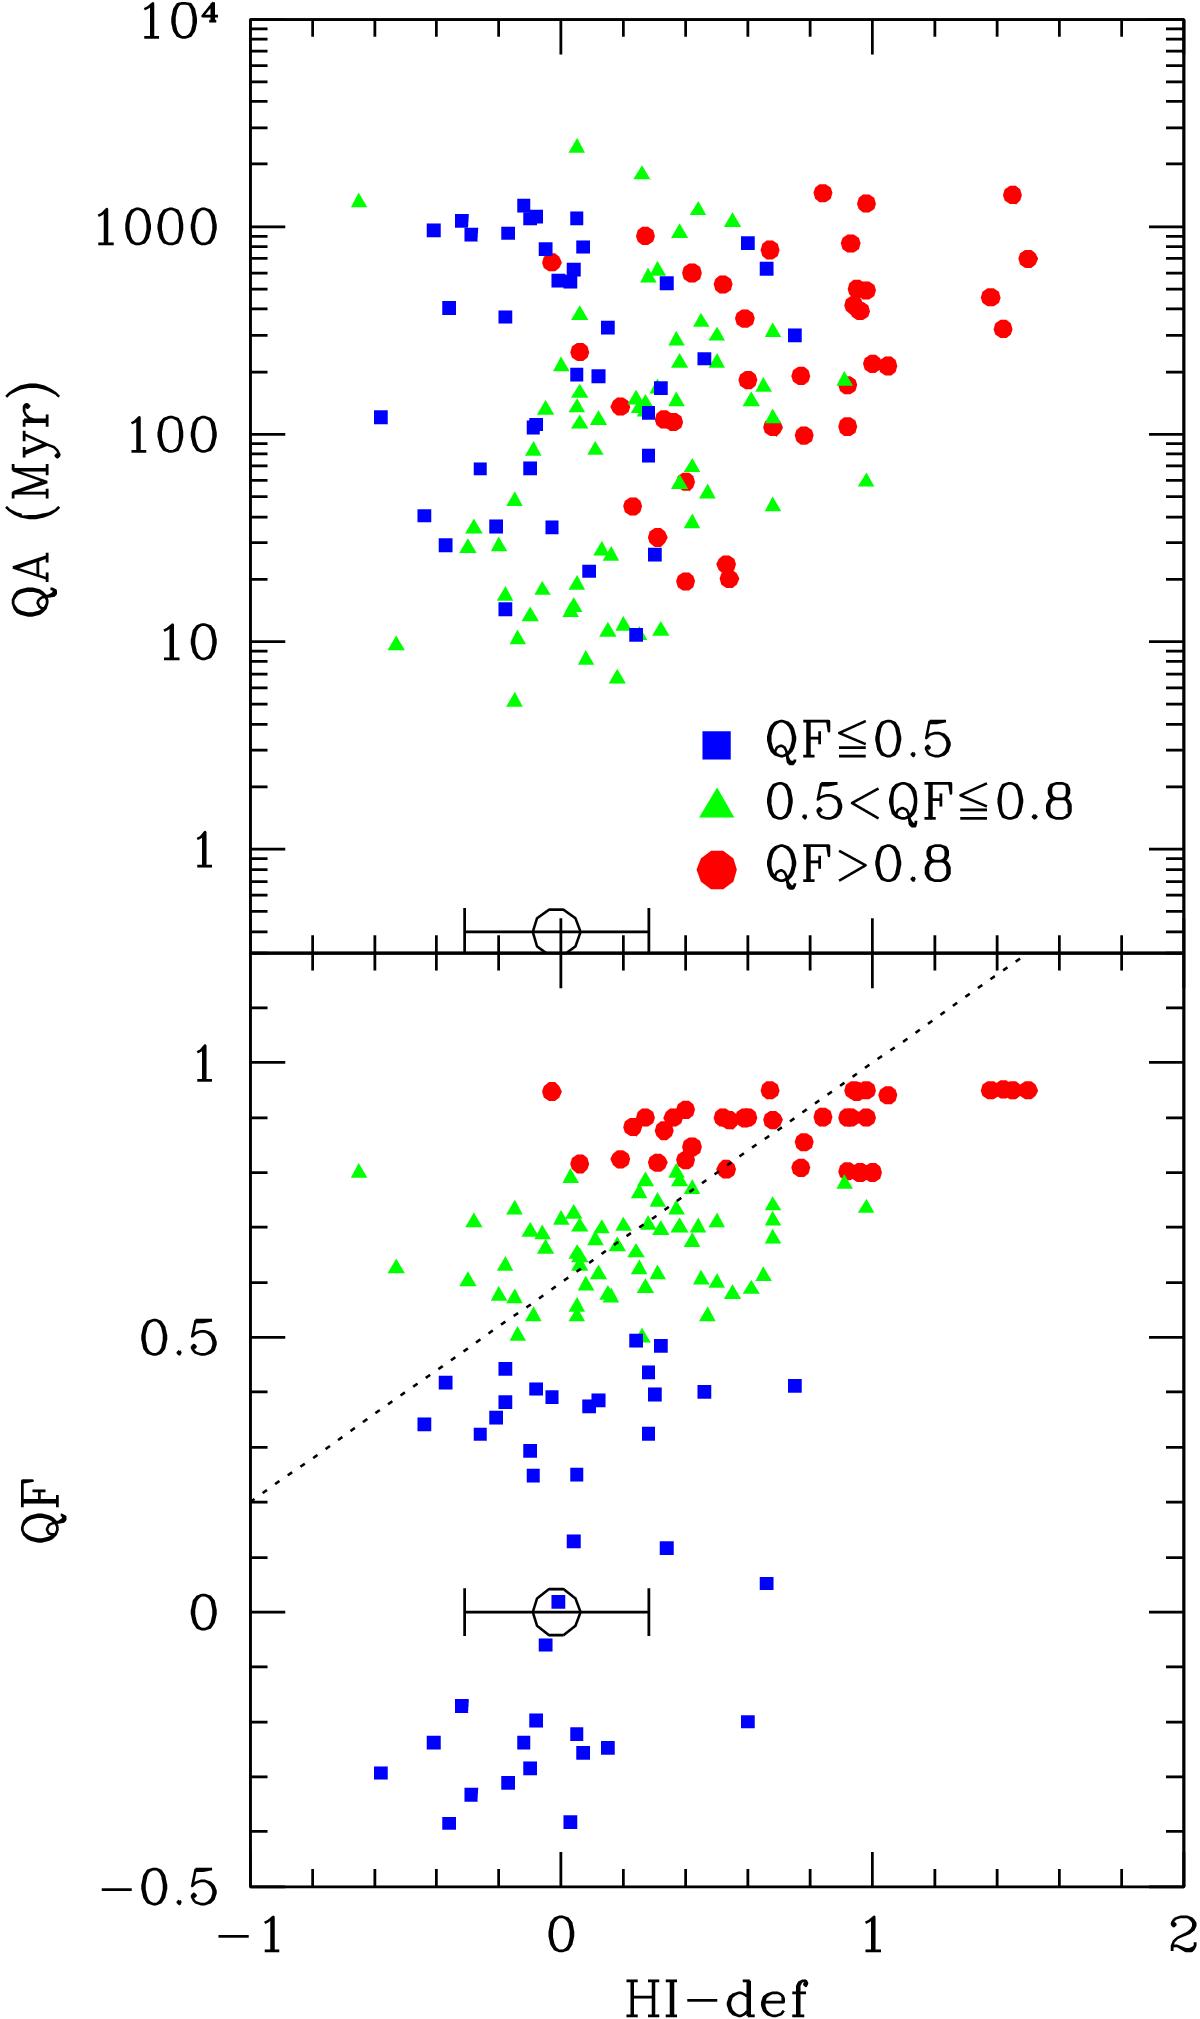
Relationship between the quenching age QA (upper panel) and the quenching factor QF (lower panel) and the HI-deficiency parameter for objects with ![]() . Blue filled squares, green triangles, and red circles are for galaxies where the derived quenching factor is QF ≤ 0.5, 0.5 <QF ≤ 0.8, and QF> 0.8, respectively. The large black empty symbol shows the mean value and the distribution in HI-deficiency for galaxies with a QF ≤ 0.5 (for which the quenching factor and quenching age are arbitrarily set to QF = 0 and QA = 0.4 Myr). The dotted line in the lower panel indicates the best fit found by Ciesla et al. (2016).
. Blue filled squares, green triangles, and red circles are for galaxies where the derived quenching factor is QF ≤ 0.5, 0.5 <QF ≤ 0.8, and QF> 0.8, respectively. The large black empty symbol shows the mean value and the distribution in HI-deficiency for galaxies with a QF ≤ 0.5 (for which the quenching factor and quenching age are arbitrarily set to QF = 0 and QA = 0.4 Myr). The dotted line in the lower panel indicates the best fit found by Ciesla et al. (2016).
Current usage metrics show cumulative count of Article Views (full-text article views including HTML views, PDF and ePub downloads, according to the available data) and Abstracts Views on Vision4Press platform.
Data correspond to usage on the plateform after 2015. The current usage metrics is available 48-96 hours after online publication and is updated daily on week days.
Initial download of the metrics may take a while.