Fig. 13
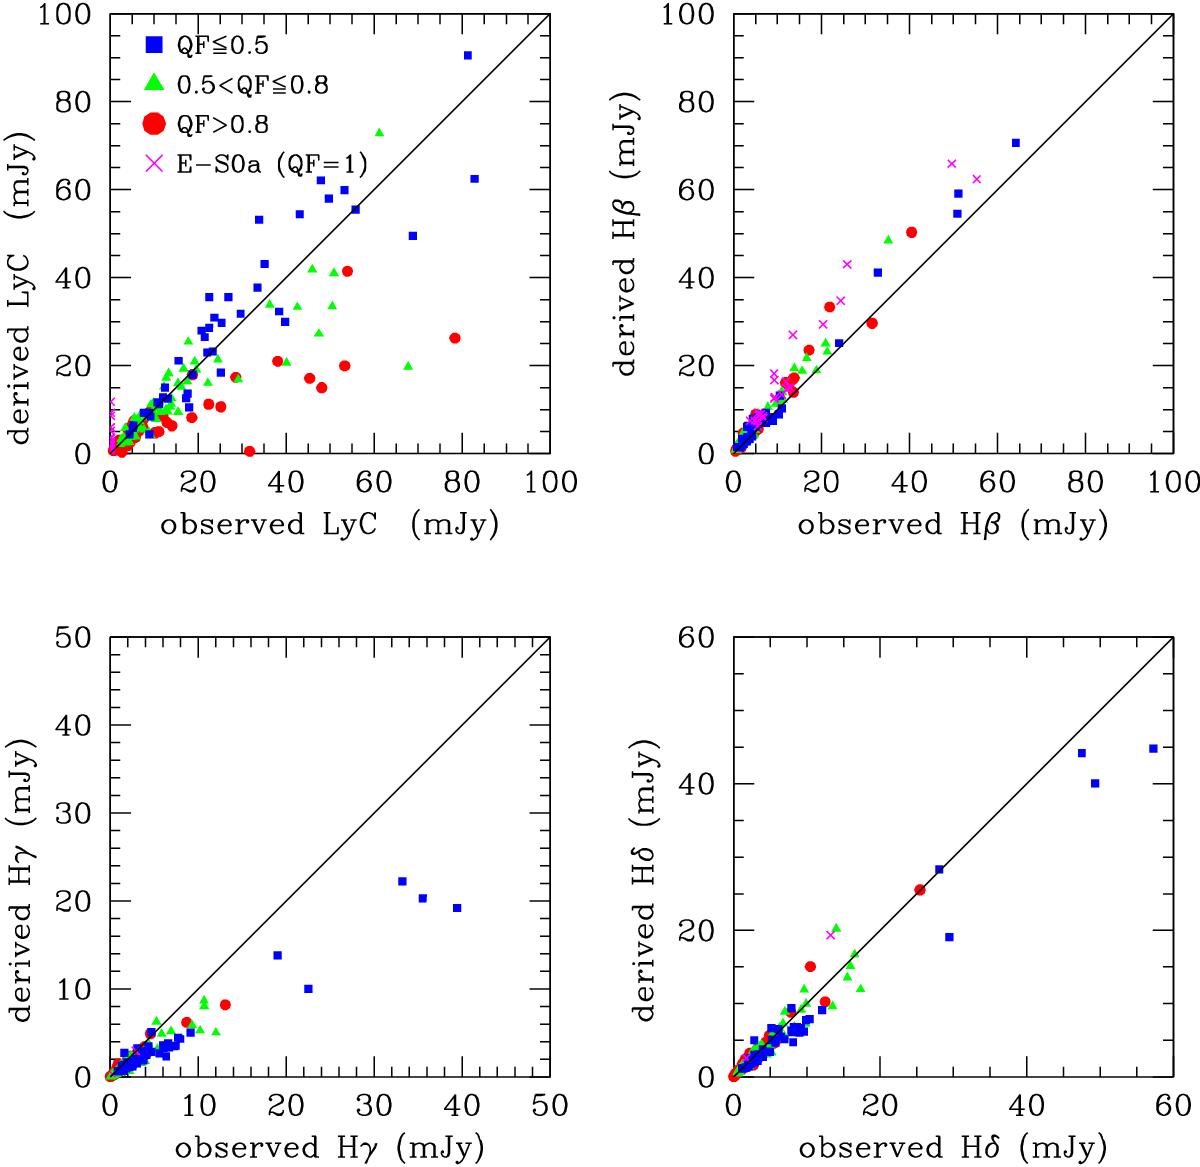
Relationship between the flux densities measured within the four different pseudo-filters defined in this work on the best-fit model and those measured on the observed spectra. The solid line indicates the 1:1 relation. Blue filled squares, green triangles, red circles, and magenta crosses are for galaxies where the derived quenching factor is QF ≤ 0.5, 0.5 <QF ≤ 0.8, QF> 0.8, and early-type galaxies (all with QF = 1), respectively.
Current usage metrics show cumulative count of Article Views (full-text article views including HTML views, PDF and ePub downloads, according to the available data) and Abstracts Views on Vision4Press platform.
Data correspond to usage on the plateform after 2015. The current usage metrics is available 48-96 hours after online publication and is updated daily on week days.
Initial download of the metrics may take a while.