Fig. 12
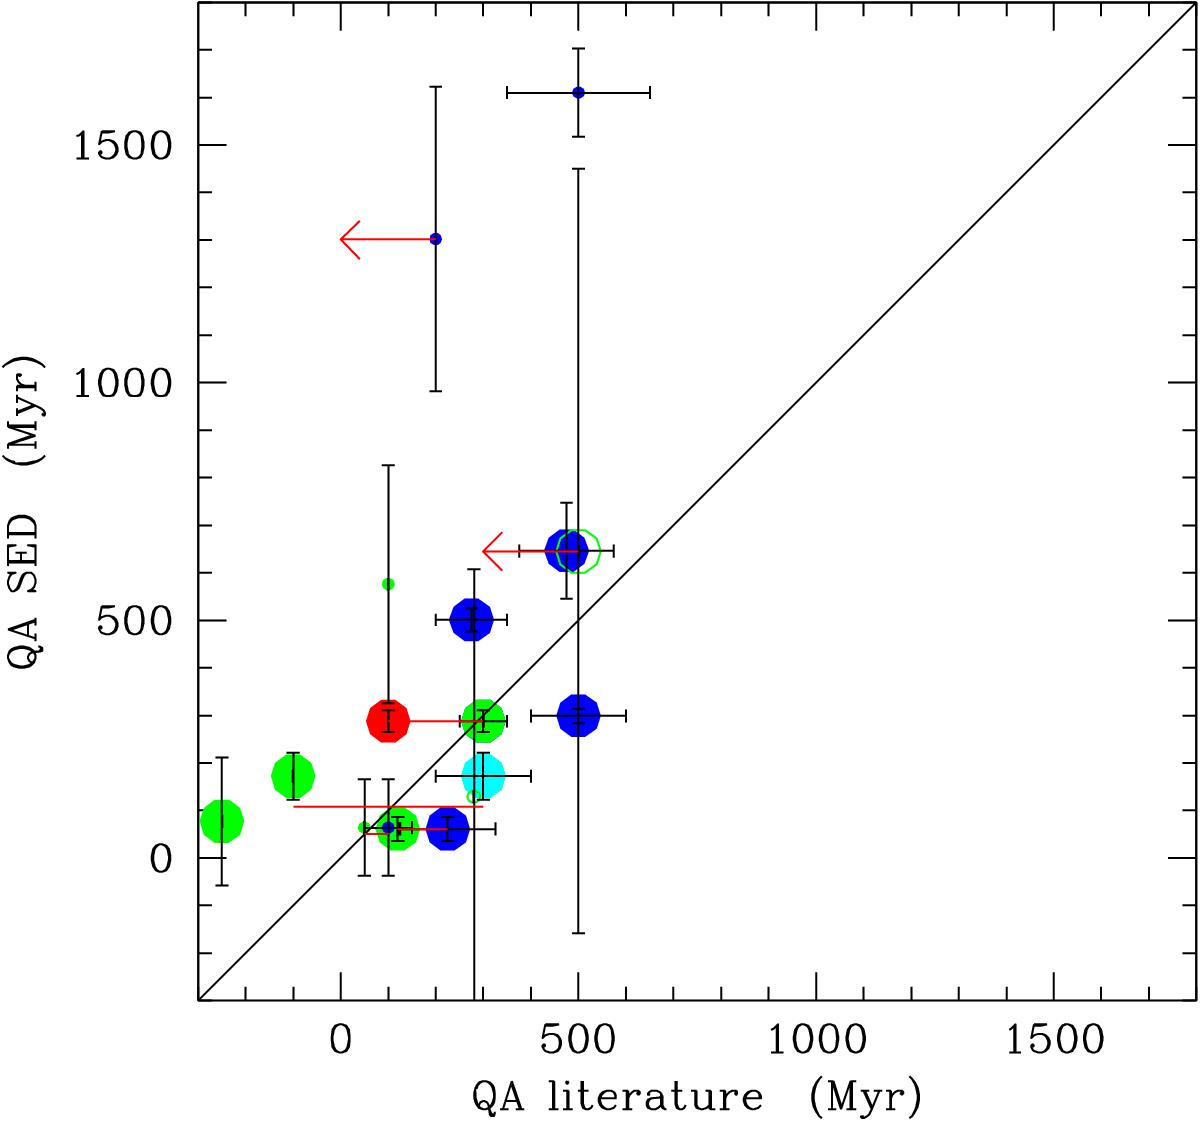
Relationship between the quenching age derived using our SED fitting technique and that derived using multizone chemo-spectrophotometric models of galaxy evolution for NGC 4569 (red dot), dynamical models based on the HI and CO gas kinematics (green dots), IFU spectroscopy of the outer disc of some cluster galaxies (blue dots), and photometric data compared to population synthesis models (cyan dots). Filled symbols are used for galaxies with a quenching factor QF> 0.5, empty dots for those with QF ≤ 0.5. Large symbols are for galaxies with a reduced ![]() , small symbols for
, small symbols for ![]() . The red lines connecting two points are used to indicate galaxies for which two independent quenching ages are available in the literature. The red arrows indicate upper limits to the quenching age given in the literature. The data used for this plot are given in Table 6. The solid diagonal line indicates the 1:1 relationship.
. The red lines connecting two points are used to indicate galaxies for which two independent quenching ages are available in the literature. The red arrows indicate upper limits to the quenching age given in the literature. The data used for this plot are given in Table 6. The solid diagonal line indicates the 1:1 relationship.
Current usage metrics show cumulative count of Article Views (full-text article views including HTML views, PDF and ePub downloads, according to the available data) and Abstracts Views on Vision4Press platform.
Data correspond to usage on the plateform after 2015. The current usage metrics is available 48-96 hours after online publication and is updated daily on week days.
Initial download of the metrics may take a while.