Fig. 11
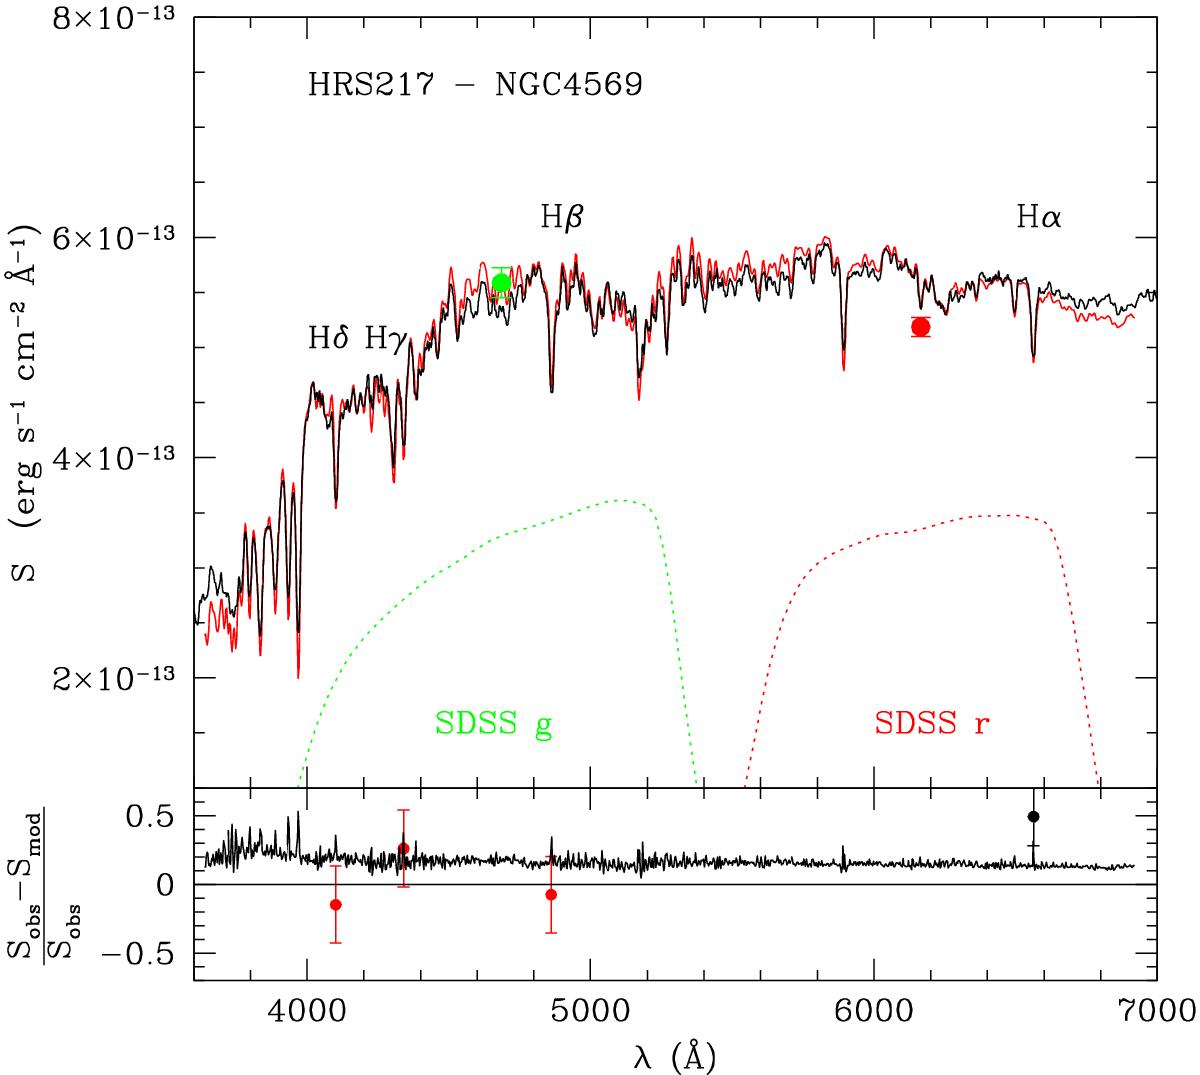
Integrated spectrum of NGC 4569, with a resolution of R ~ 1000, corrected for line emission (red line), normalised to the flux density in the g band (green filled dot), compared to the best-fit model derived by CIGALE using a truncated star formation history (black solid line; the model spectrum is shifted on the Y-axis by a factor of +8 × 10-14 to match the observed spectrum). The red filled dot shows the r-band photometric point, and the transmissivity of the SDSS g and r bands is traced by the green and red dotted curves (upper panel). The normalised difference between the two spectra is plotted vs. lambda in the lower panel. The red filled dots indicate the normalised difference between the values of the Hβ, Hγ, and Hδ pseudo-filters and those measured on the best-fit model. The black filled dot at λ6563 Å shows the normalised difference between the observed Lyman-continuum pseudo-filter, derived from the extinction-corrected Hα image of the galaxy, and the Lyman-continuum flux measured on the best-fit model.
Current usage metrics show cumulative count of Article Views (full-text article views including HTML views, PDF and ePub downloads, according to the available data) and Abstracts Views on Vision4Press platform.
Data correspond to usage on the plateform after 2015. The current usage metrics is available 48-96 hours after online publication and is updated daily on week days.
Initial download of the metrics may take a while.