Fig. 10
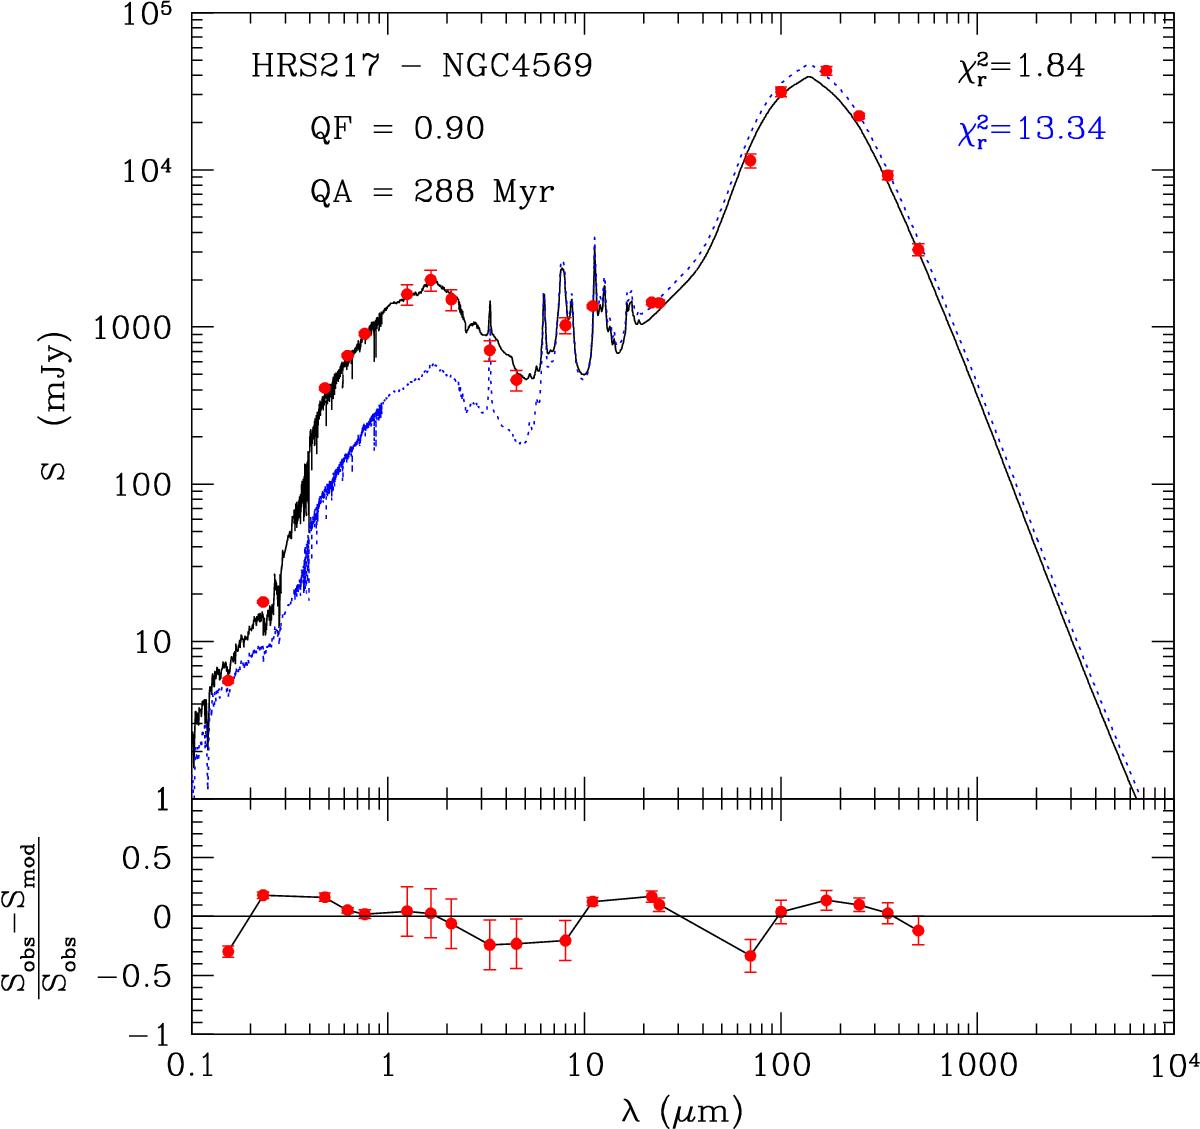
Observed UV to FIR SED of NGC 4569 (HRS 217) (red filled dots) is compared to the best-fit model derived by CIGALE using a truncated star formation history (black solid line) or a normal delayed star formation history (blue dotted line) (upper panel). The normalised difference between the observed and model value in the different photometric bands is plotted vs. lambda in the lower panel (for a truncated star formation history).
Current usage metrics show cumulative count of Article Views (full-text article views including HTML views, PDF and ePub downloads, according to the available data) and Abstracts Views on Vision4Press platform.
Data correspond to usage on the plateform after 2015. The current usage metrics is available 48-96 hours after online publication and is updated daily on week days.
Initial download of the metrics may take a while.