Fig. 3
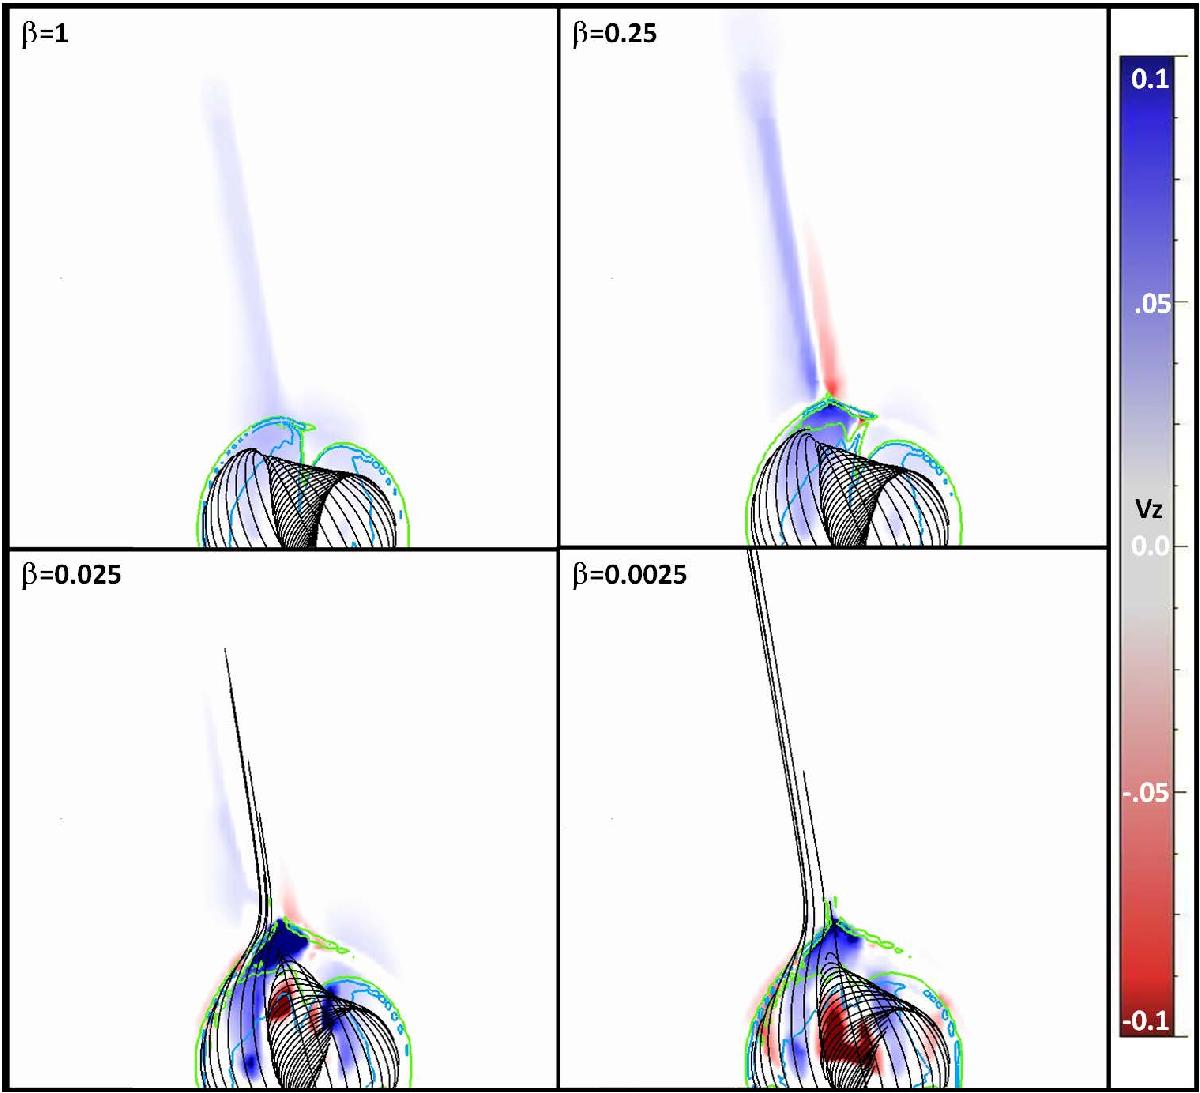
Vertical velocity, vz distribution in the y−z plane at x = 0 at t = 625, during the straight jet/pre-helical jet phase for simulations with different plasma β highlighting the presence of a straight jet for the runs at higher β. The velocity magnitude is color coded in blue (upflows) and red (downflows). For comparison, the ambient Alfvén speed is ĉA = 0.28. The black field lines, all initially closed correspond to the cyan field lines of Fig. 2. Open black field lines for lower β runs indicate the occurrence of relatively more intense reconnection by this stage. The blue and green lines are isocontours of the electric current density.
Current usage metrics show cumulative count of Article Views (full-text article views including HTML views, PDF and ePub downloads, according to the available data) and Abstracts Views on Vision4Press platform.
Data correspond to usage on the plateform after 2015. The current usage metrics is available 48-96 hours after online publication and is updated daily on week days.
Initial download of the metrics may take a while.