Fig. 2
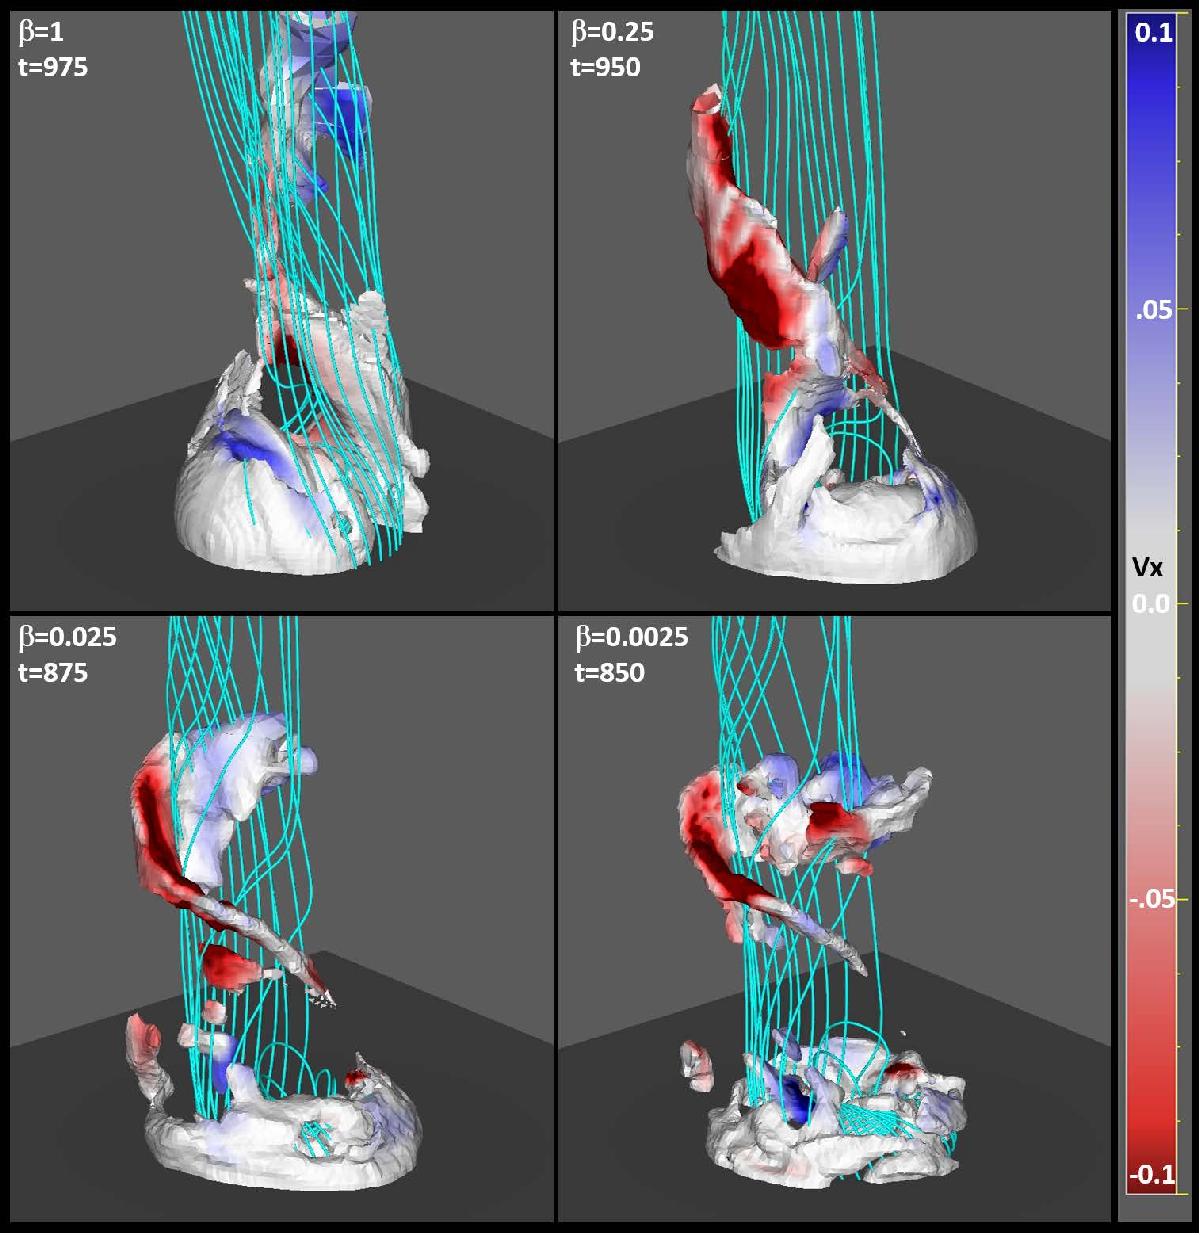
Morphology of the helical jet during the blowout for simulations with different plasma β. The cyan field lines, which were all initially closed, are plotted from fixed points along the bottom boundary on a circle of radius 1.6L0. The helical jet in each simulation is highlighted by an isosurface of the plasma density equal to ![]() from the highest to the lowest β case respectively, color-coded according to the transverse velocity component vx: red indicates velocity oriented toward the right, and blue toward the left. For comparison, the initial uniform density
from the highest to the lowest β case respectively, color-coded according to the transverse velocity component vx: red indicates velocity oriented toward the right, and blue toward the left. For comparison, the initial uniform density ![]() and the ambient Alfvén speed ĉA = 0.28. At the center of the domain the field of view extends vertically from 0 to ≈20L0.
and the ambient Alfvén speed ĉA = 0.28. At the center of the domain the field of view extends vertically from 0 to ≈20L0.
Current usage metrics show cumulative count of Article Views (full-text article views including HTML views, PDF and ePub downloads, according to the available data) and Abstracts Views on Vision4Press platform.
Data correspond to usage on the plateform after 2015. The current usage metrics is available 48-96 hours after online publication and is updated daily on week days.
Initial download of the metrics may take a while.