Fig. 3
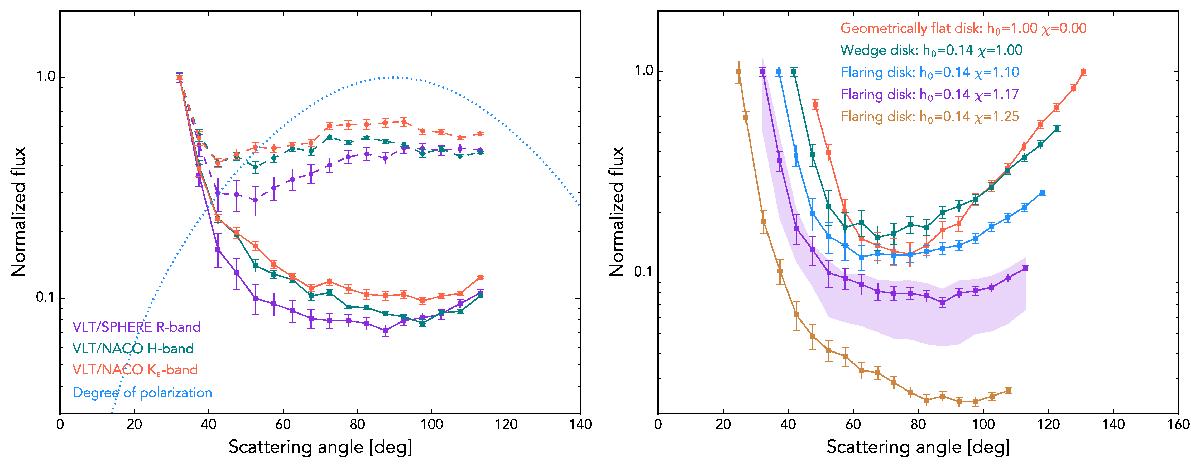
Left: observed polarized intensity phase functions (dashed lines) and reconstructed total intensity phase functions (solid lines) that are calculated by assuming a bell-shaped degree of polarization (dotted line). The polarized intensity phase functions have been obtained from the Qφ scattered light images in the R′, H, and Ks bands. Each phase function has been normalized to its peak value. The error bars show three standard errors of the mean obtained from the corresponding Uφ images. Right: total intensity phase functions of the VLT/SPHERE R′ band observation for different geometries of the radial τ = 1 disk surface (see Eq. (2)). Throughout this work we use h0 = 0.14 and χ = 1.17 (purple data points) which were obtained from the radiative transfer model of Mulders et al. (2013). The purple shaded region shows the effect of the inclination (40°−45°) on the derived phase function for the τ = 1 geometry with h0 = 0.14 and χ = 1.17.
Current usage metrics show cumulative count of Article Views (full-text article views including HTML views, PDF and ePub downloads, according to the available data) and Abstracts Views on Vision4Press platform.
Data correspond to usage on the plateform after 2015. The current usage metrics is available 48-96 hours after online publication and is updated daily on week days.
Initial download of the metrics may take a while.