Fig. 2
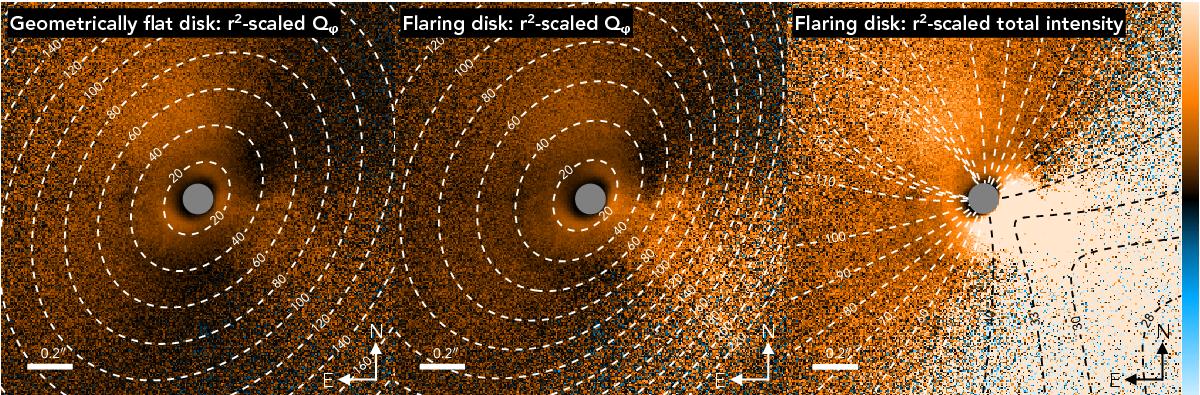
Left: VLT/SPHERE coronagraphic R′ band Qφ image of HD 100546 (Garufi et al. 2016). The image is r2-scaled with a correction only for the inclination of the disk. Center: the same Qφ image with a correction for both the inclination and height of the flaring disk surface. Right: reconstructed r2-scaled total intensity image obtained by applying a correction for the degree of polarization on the Qφ image. All images show a 2.′′0 × 2.′′0 field of view on the same linear color scale with equal minimum and maximum value. Orange corresponds to positive values, blue to negative values, and black is the zero-point. The 155 mas diameter coronagraph has been masked out. The contours of the left and center image show the radial distance from the central star to the point of scattering in the disk surface that is used for the r2-scaling. The contours of the right image show the local scattering angles that are used to calculate the phase function and estimate the total intensity.
Current usage metrics show cumulative count of Article Views (full-text article views including HTML views, PDF and ePub downloads, according to the available data) and Abstracts Views on Vision4Press platform.
Data correspond to usage on the plateform after 2015. The current usage metrics is available 48-96 hours after online publication and is updated daily on week days.
Initial download of the metrics may take a while.