Free Access
Fig. 2
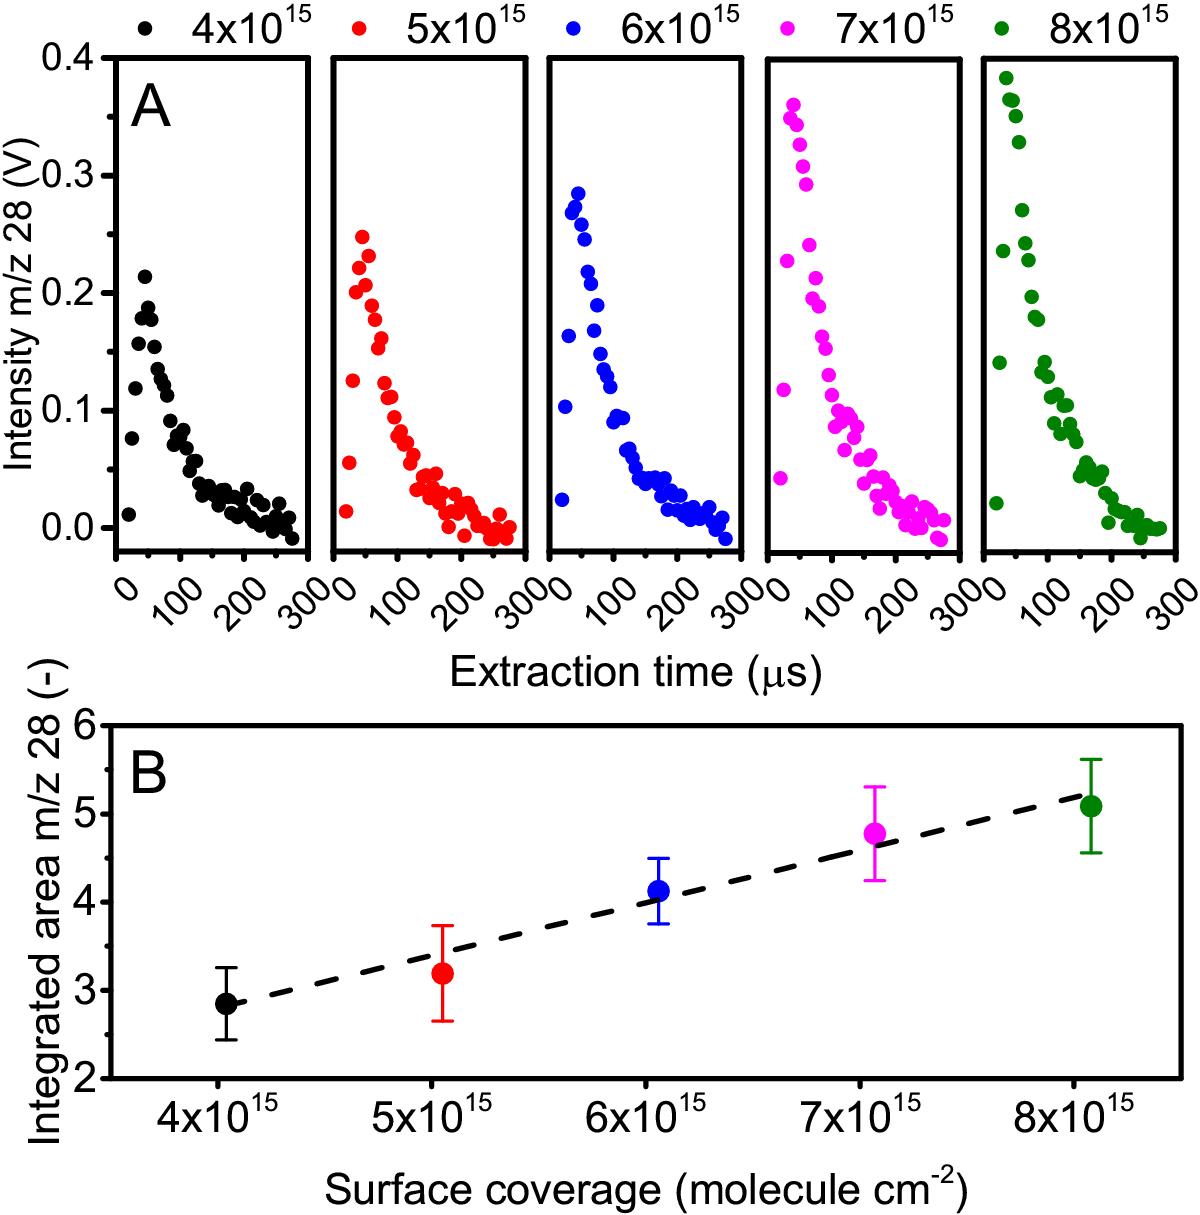
Upper panel A): plume profiles observed for m/z = 28 for different CO substrate coverage ranging from 4 × 10¹⁵ molecules cm-2 to 8×10¹⁵ molecules cm-2 upon laser induced desorption. Lower panelB): integrated area of m/z = 28 of the complete plume profiles for the corresponding surface coverage (same colour coding).
Current usage metrics show cumulative count of Article Views (full-text article views including HTML views, PDF and ePub downloads, according to the available data) and Abstracts Views on Vision4Press platform.
Data correspond to usage on the plateform after 2015. The current usage metrics is available 48-96 hours after online publication and is updated daily on week days.
Initial download of the metrics may take a while.