Free Access
Fig. 5
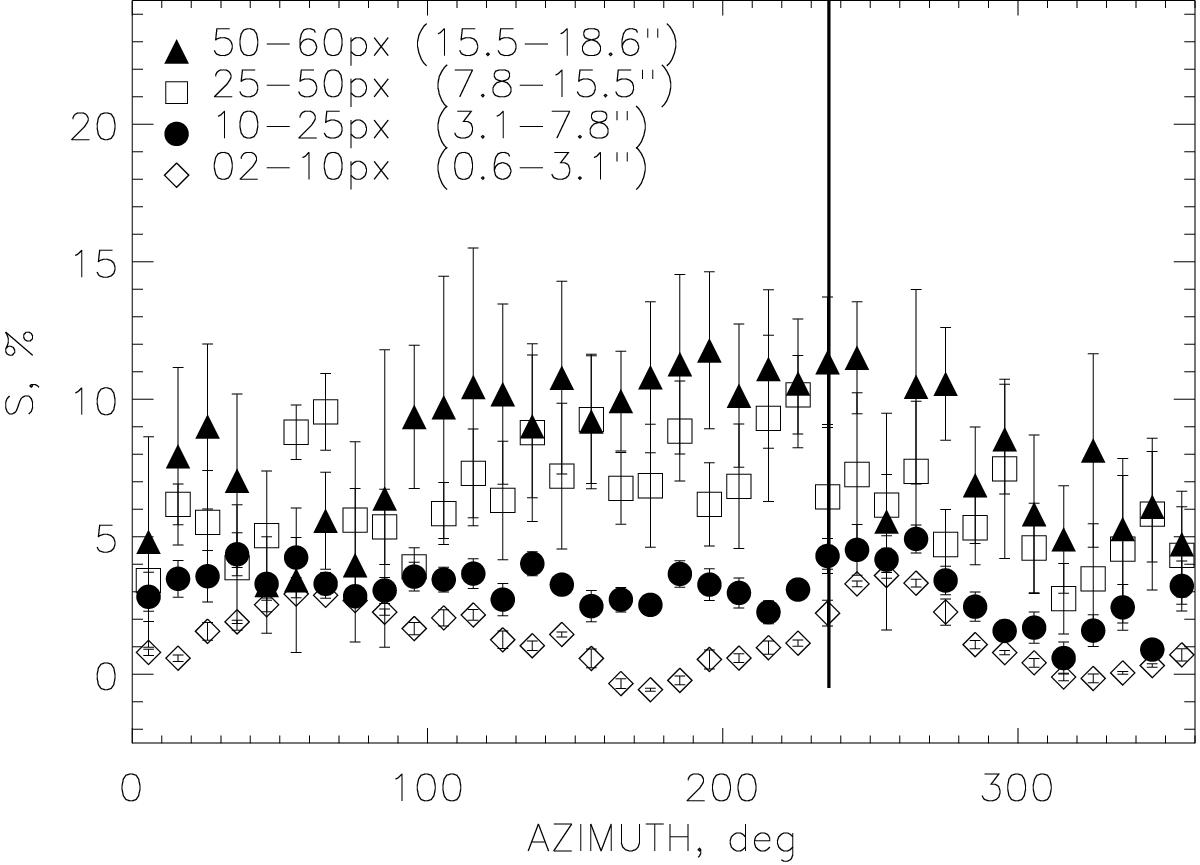
Azimuthal stretch of the normalized spectral gradient of the W3 coma. Four values are depicted for each azimuth, which are averaged within the fixed intervals of radius-vectors (shown as a legend). Uncertainties are 3σ rms errors computed within the intervals.
Current usage metrics show cumulative count of Article Views (full-text article views including HTML views, PDF and ePub downloads, according to the available data) and Abstracts Views on Vision4Press platform.
Data correspond to usage on the plateform after 2015. The current usage metrics is available 48-96 hours after online publication and is updated daily on week days.
Initial download of the metrics may take a while.