Fig. 2
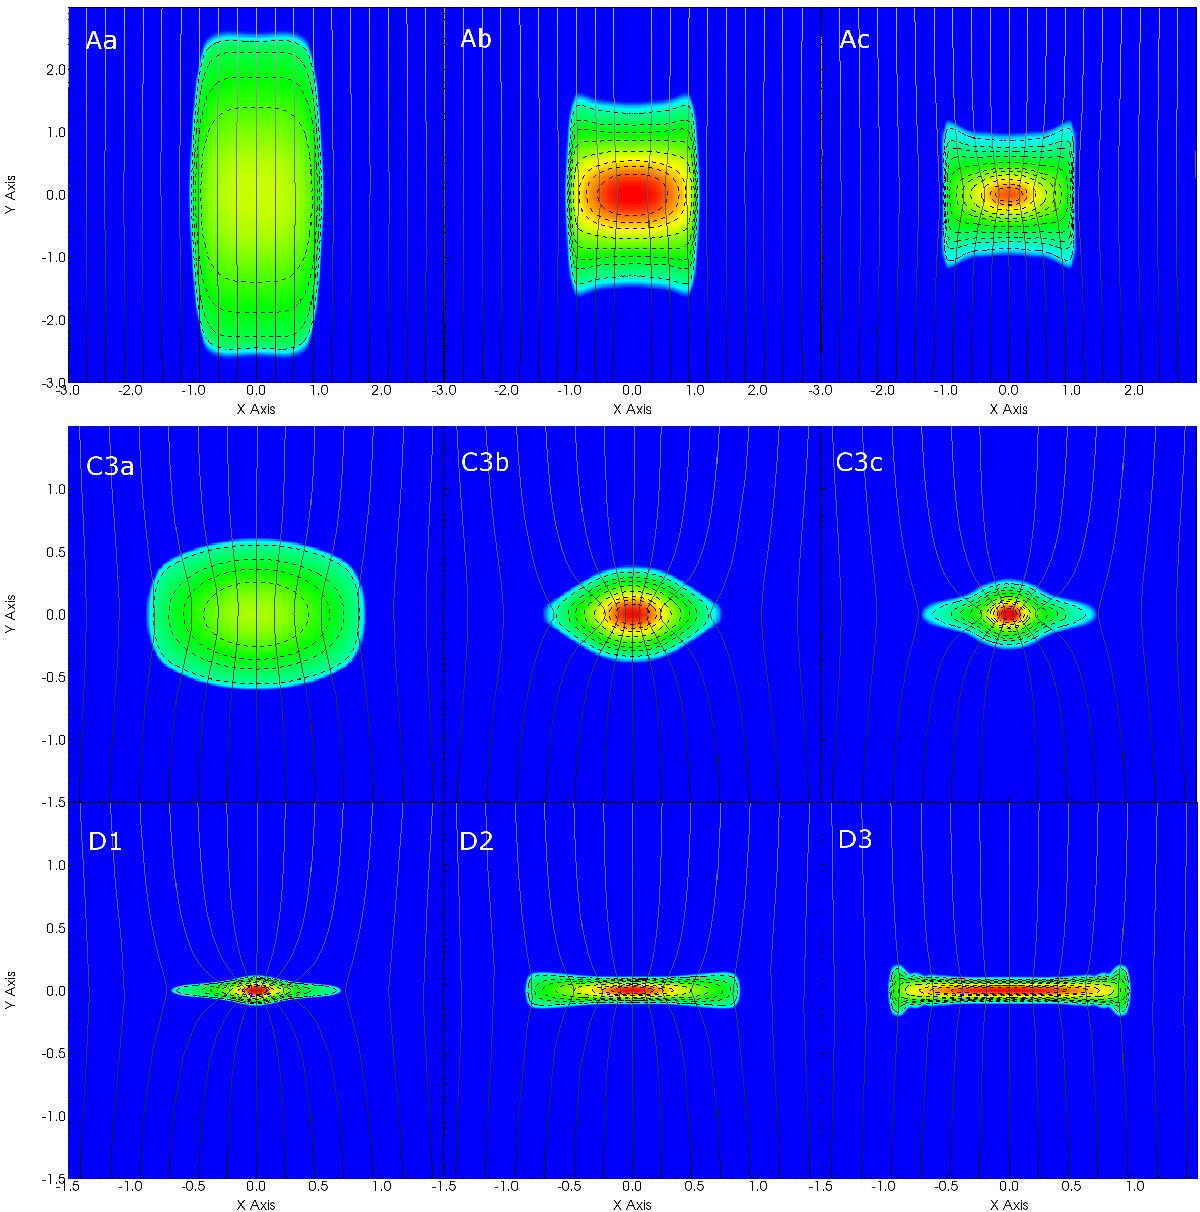
Normalised logarithmic density, ρ/ρS, of the equilibrium configuration for the models listed in Table 1. The density range is from 0.1 to 100, except for model Ac and C3c which have a maximum density of 1000 and 300, respectively. The dashed lines show contour lines for density values of 1, 2, 3, 5, 10, 20, 30, 50, 100, 200, 300 and 500. The magnetic field lines are shown by the solid lines.
Current usage metrics show cumulative count of Article Views (full-text article views including HTML views, PDF and ePub downloads, according to the available data) and Abstracts Views on Vision4Press platform.
Data correspond to usage on the plateform after 2015. The current usage metrics is available 48-96 hours after online publication and is updated daily on week days.
Initial download of the metrics may take a while.