Fig. 6
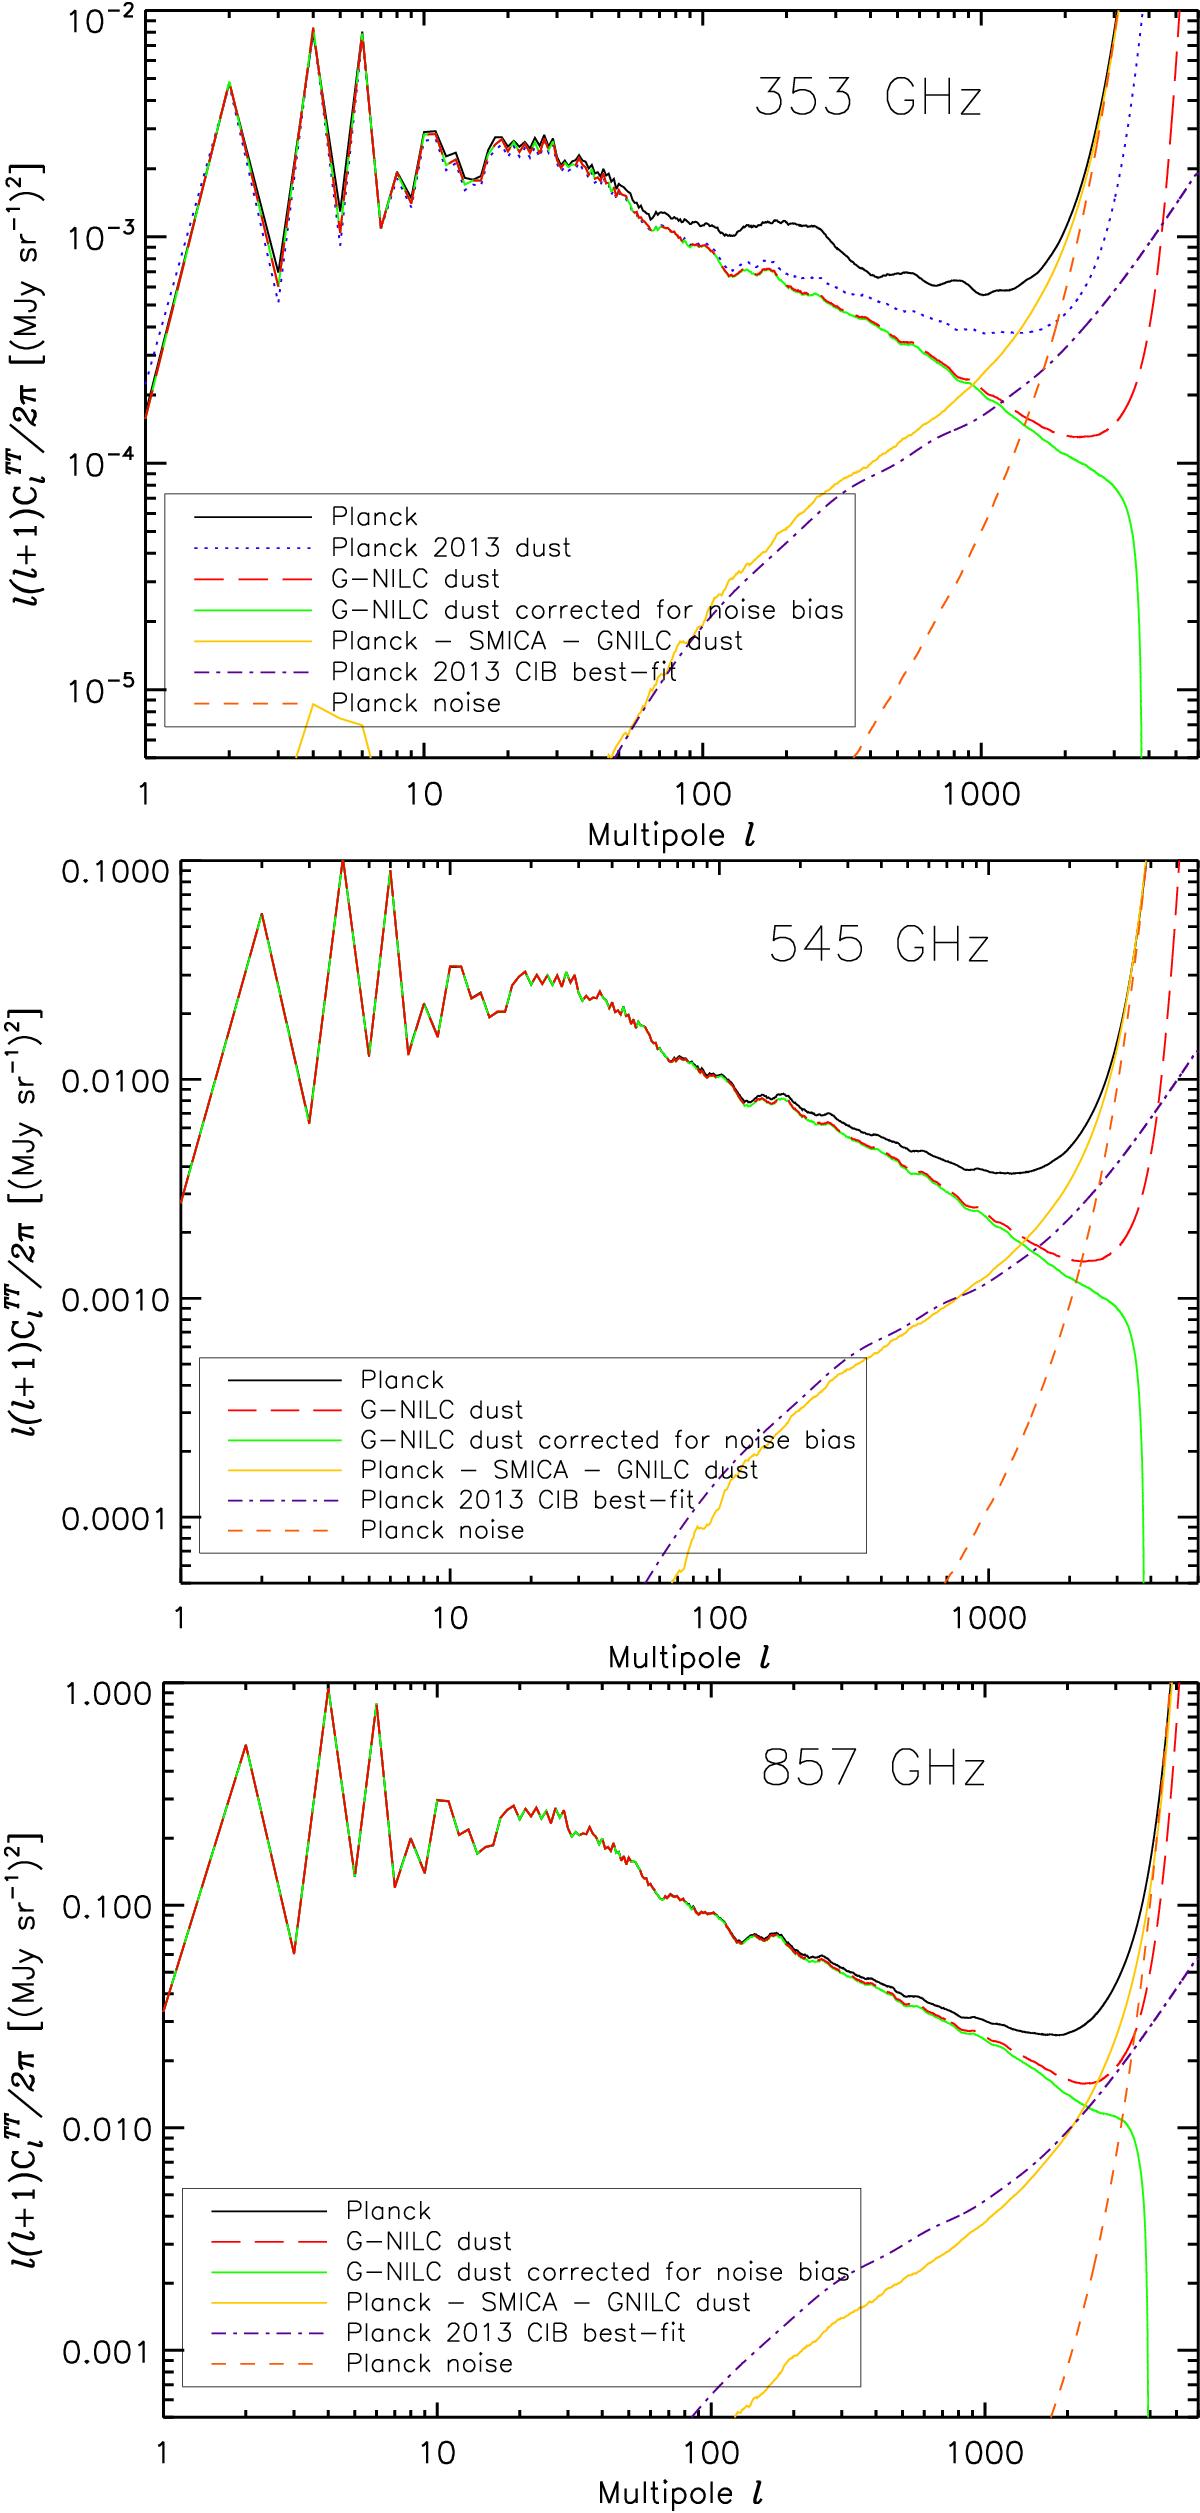
Angular power spectra of the various maps at 353 GHz (top panel), 545 GHz (middle panel), and 857 GHz (bottom panel), on a fraction of the sky, fsky = 57%: Planck map (solid black line), dust model P13 (dotted blue line, Planck Collaboration XI 2014), GNILC dust map (long dashed red line), GNILC dust map corrected for the residual noise (solid green line), and GNILC residual map (Planck map −Planck CMB −GNILC dust, solid yellow line), which is compared to the Planck CIB best-fit power spectrum (dash-dot purple line, Planck Collaboration XXX 2014) and the Planck noise power spectrum (dashed orange line).
Current usage metrics show cumulative count of Article Views (full-text article views including HTML views, PDF and ePub downloads, according to the available data) and Abstracts Views on Vision4Press platform.
Data correspond to usage on the plateform after 2015. The current usage metrics is available 48-96 hours after online publication and is updated daily on week days.
Initial download of the metrics may take a while.