Fig. 5
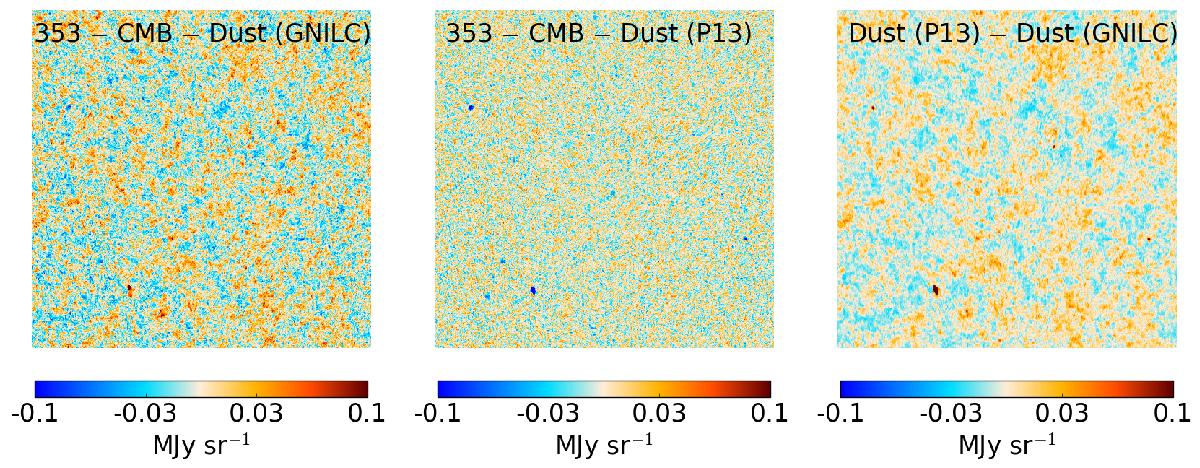
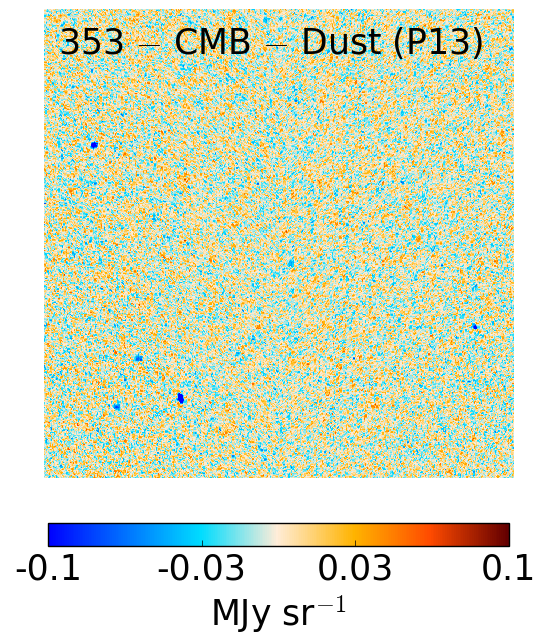
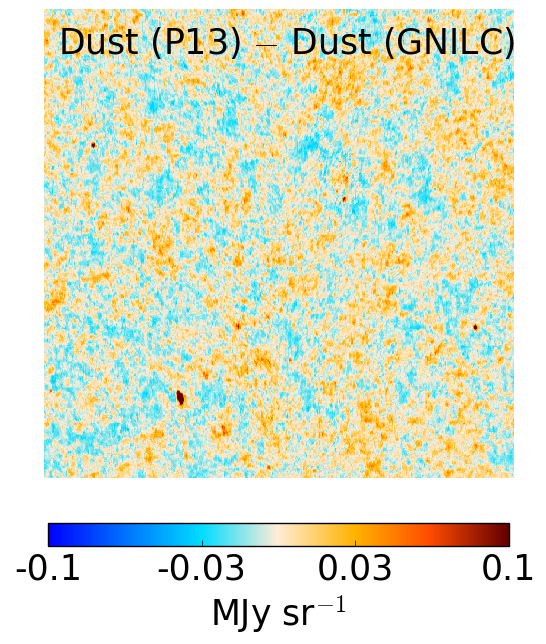
![]() gnomonic projection of the sky centred at high latitude, (l,b) = (90°,−80°). Left: difference map (Planck 353 GHz −Planck CMB −GNILC dust) reveals the CIB anisotropies at 353 GHz. Middle: difference map (Planck 353 GHz – Planck CMB – dust model P13) revealing only the instrumental noise because the dust model P13, like the Planck observations at 353 GHz, still contains the CIB signal. Right: difference (dust model P13 – GNILC dust) revealing the amount of CIB contamination in the dust model P13 with respect to the GNILC dust map. In these images, the local mean intensity of each map has been subtracted.
gnomonic projection of the sky centred at high latitude, (l,b) = (90°,−80°). Left: difference map (Planck 353 GHz −Planck CMB −GNILC dust) reveals the CIB anisotropies at 353 GHz. Middle: difference map (Planck 353 GHz – Planck CMB – dust model P13) revealing only the instrumental noise because the dust model P13, like the Planck observations at 353 GHz, still contains the CIB signal. Right: difference (dust model P13 – GNILC dust) revealing the amount of CIB contamination in the dust model P13 with respect to the GNILC dust map. In these images, the local mean intensity of each map has been subtracted.

Current usage metrics show cumulative count of Article Views (full-text article views including HTML views, PDF and ePub downloads, according to the available data) and Abstracts Views on Vision4Press platform.
Data correspond to usage on the plateform after 2015. The current usage metrics is available 48-96 hours after online publication and is updated daily on week days.
Initial download of the metrics may take a while.