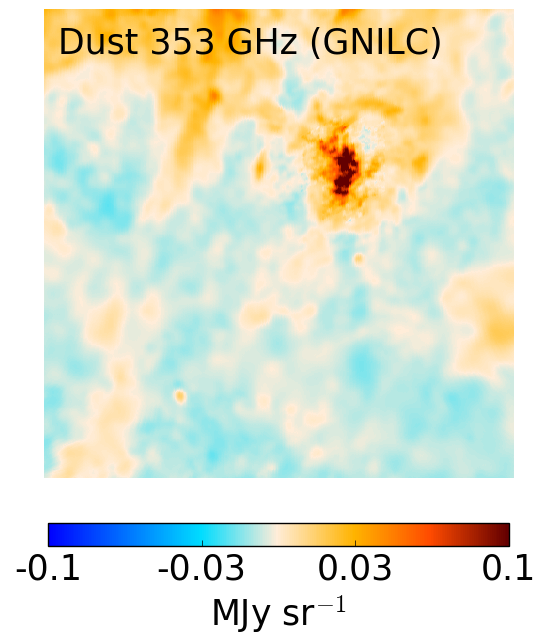
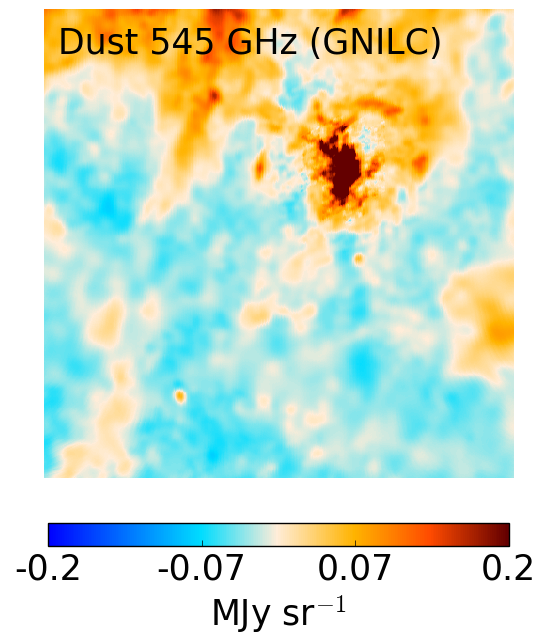
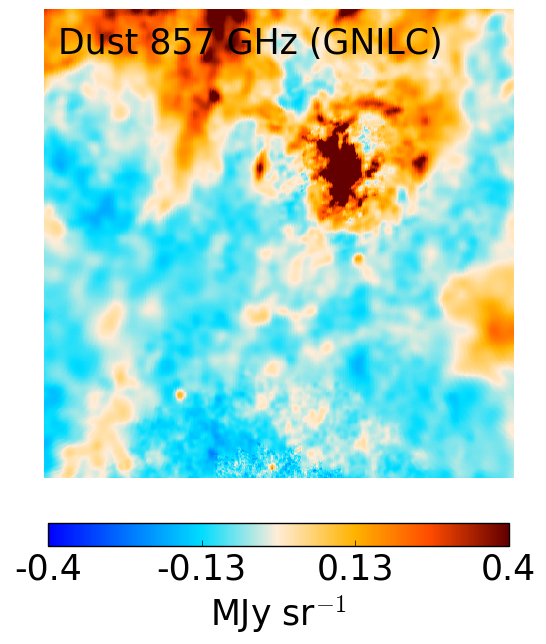
Fig. 4
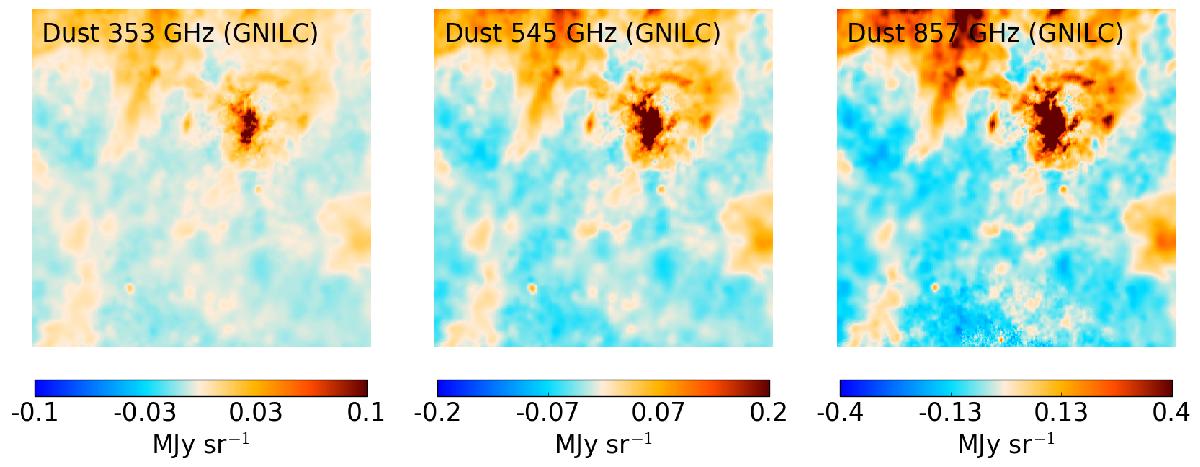
GNILC dust maps at 353 GHz (left panel), 545 GHz (middle panel), and 857 GHz (right panel) on a ![]() gnomonic projection of the sky centred at high latitude, (l,b) = (90°,−80°). GNILC filters out the CIB anisotropies while preserving the small-scale dust signal (see bottom panel of Fig. 2). In these images, the local mean intensity of each map has been subtracted.
gnomonic projection of the sky centred at high latitude, (l,b) = (90°,−80°). GNILC filters out the CIB anisotropies while preserving the small-scale dust signal (see bottom panel of Fig. 2). In these images, the local mean intensity of each map has been subtracted.
Current usage metrics show cumulative count of Article Views (full-text article views including HTML views, PDF and ePub downloads, according to the available data) and Abstracts Views on Vision4Press platform.
Data correspond to usage on the plateform after 2015. The current usage metrics is available 48-96 hours after online publication and is updated daily on week days.
Initial download of the metrics may take a while.