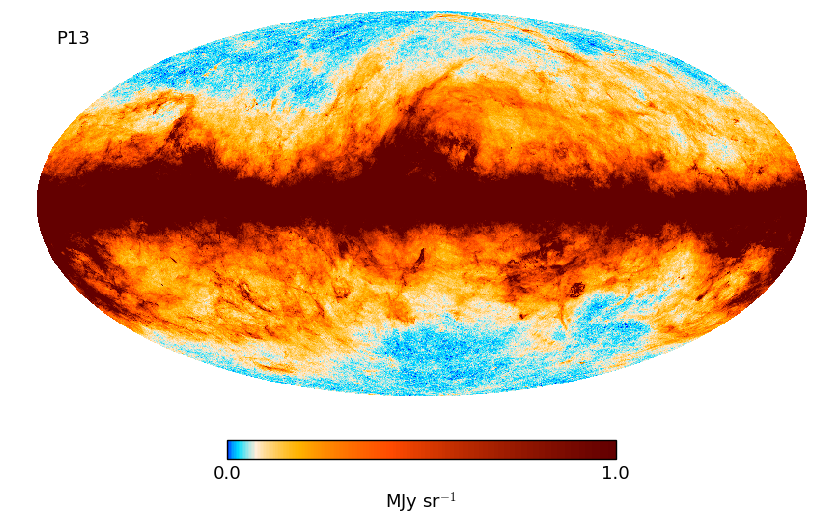
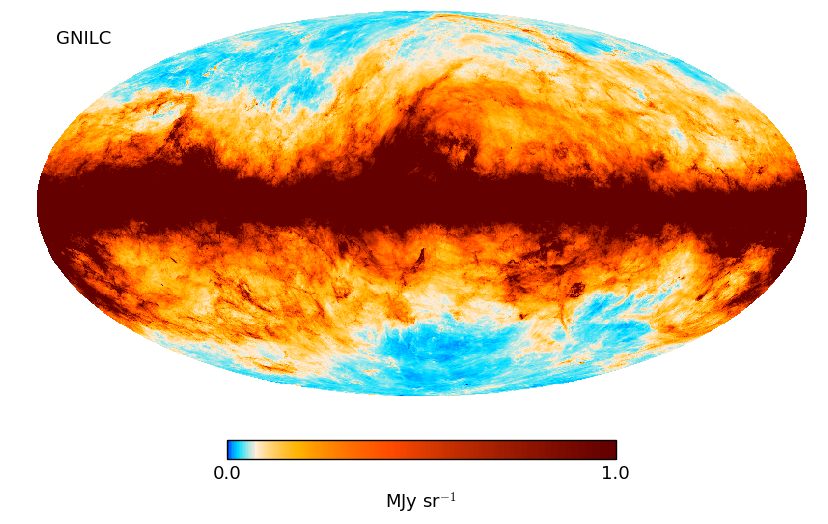
Fig. 3
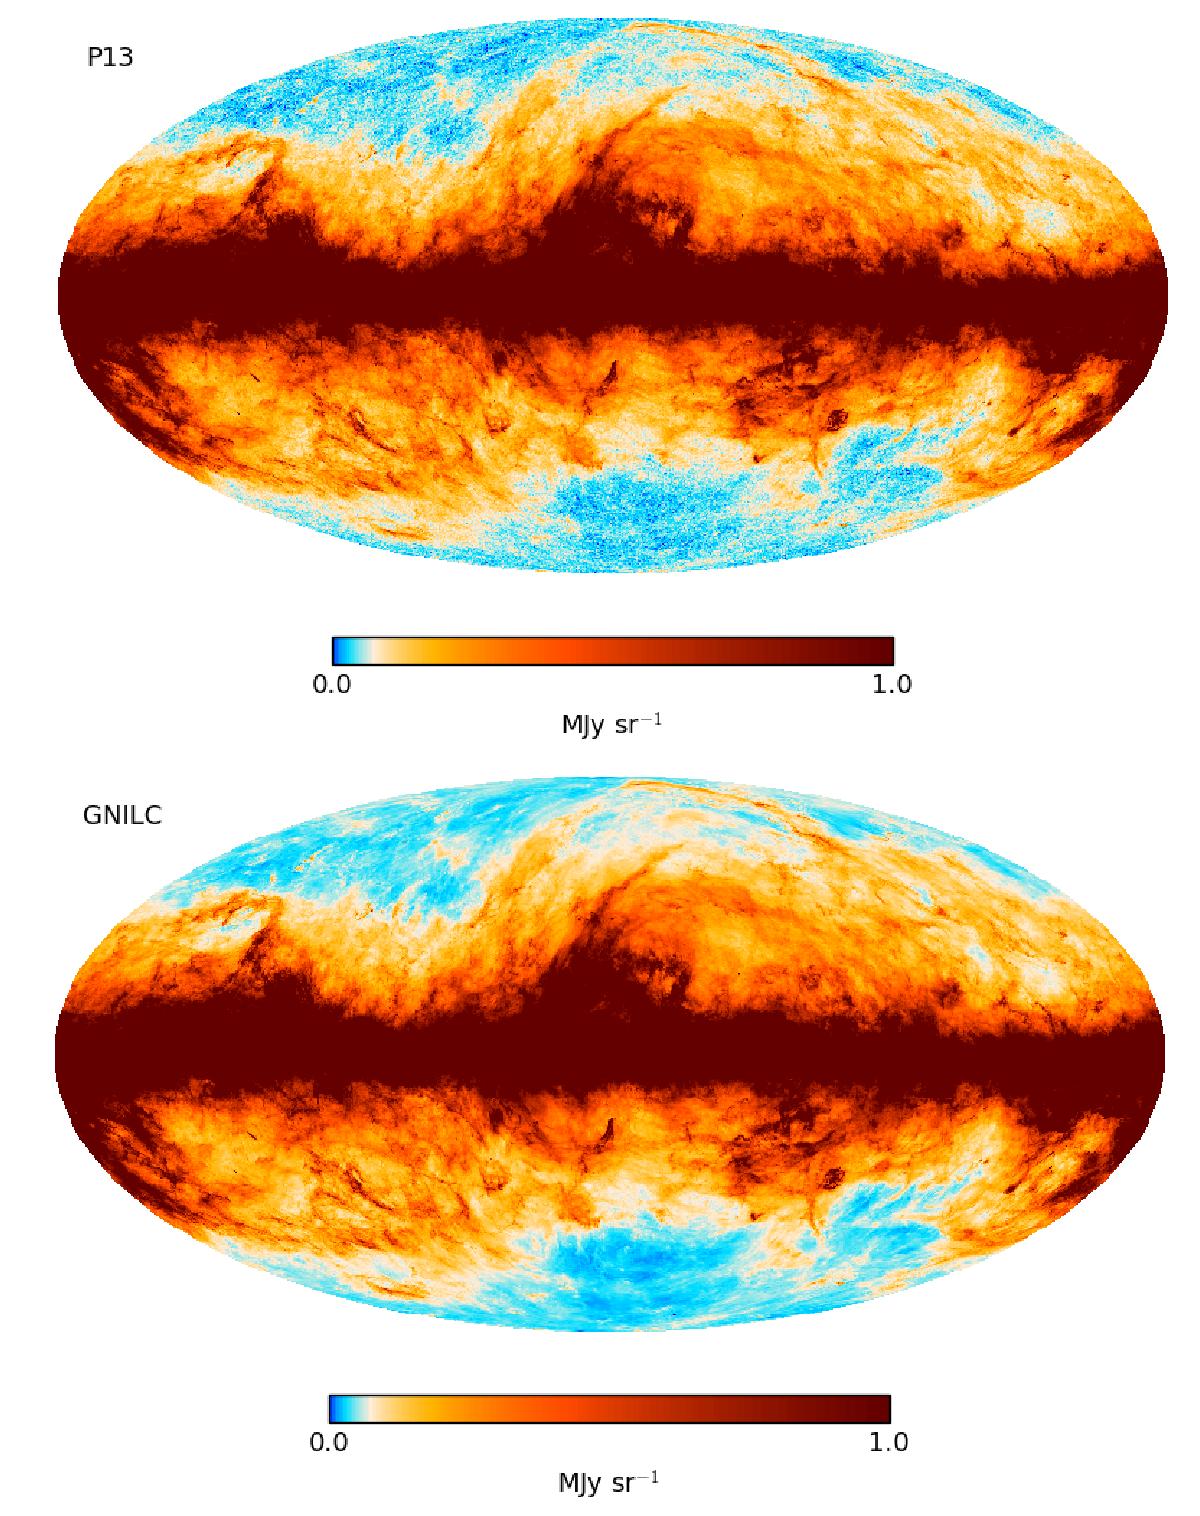
Full-sky map of the Galactic thermal dust emission: Planck 2013 (P13) thermal dust model at 353 GHz and 5′ resolution (top panel), suffering from CIB contamination at high latitudes, and the GNILC dust map (this work) at 353 GHz and 5′ resolution (bottom panel), for which the CIB is clearly filtered out at high-latitudes. A logarithmic colour scale is used here to highlight the low-intensity emission at high latitudes. The effective local beam of the GNILC dust maps is shown in Fig. 2.
Current usage metrics show cumulative count of Article Views (full-text article views including HTML views, PDF and ePub downloads, according to the available data) and Abstracts Views on Vision4Press platform.
Data correspond to usage on the plateform after 2015. The current usage metrics is available 48-96 hours after online publication and is updated daily on week days.
Initial download of the metrics may take a while.