Fig. 17
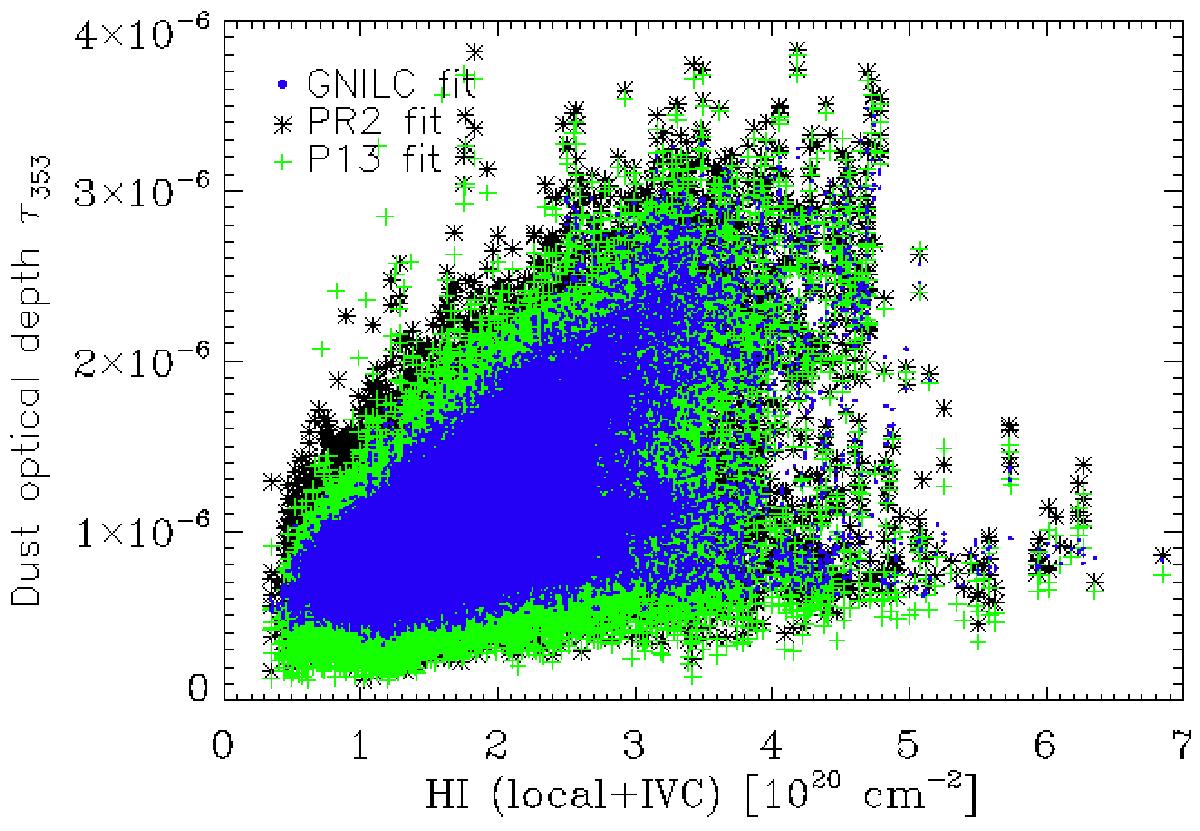
T–T scatter plot at high Galactic latitude between the H i map and the dust optical depth maps at 353 GHz: dust model P13 (green), PR2 MBB fit (black), GNILC MBB fit (blue). While the slope of the correlation with the H i map is consistent for all the dust optical depth maps, the scatter is smallest for the GNILC dust optical depth map because of the removal of the CIB temperature anisotropies.
Current usage metrics show cumulative count of Article Views (full-text article views including HTML views, PDF and ePub downloads, according to the available data) and Abstracts Views on Vision4Press platform.
Data correspond to usage on the plateform after 2015. The current usage metrics is available 48-96 hours after online publication and is updated daily on week days.
Initial download of the metrics may take a while.