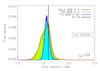
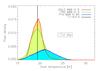
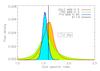
Fig. 11
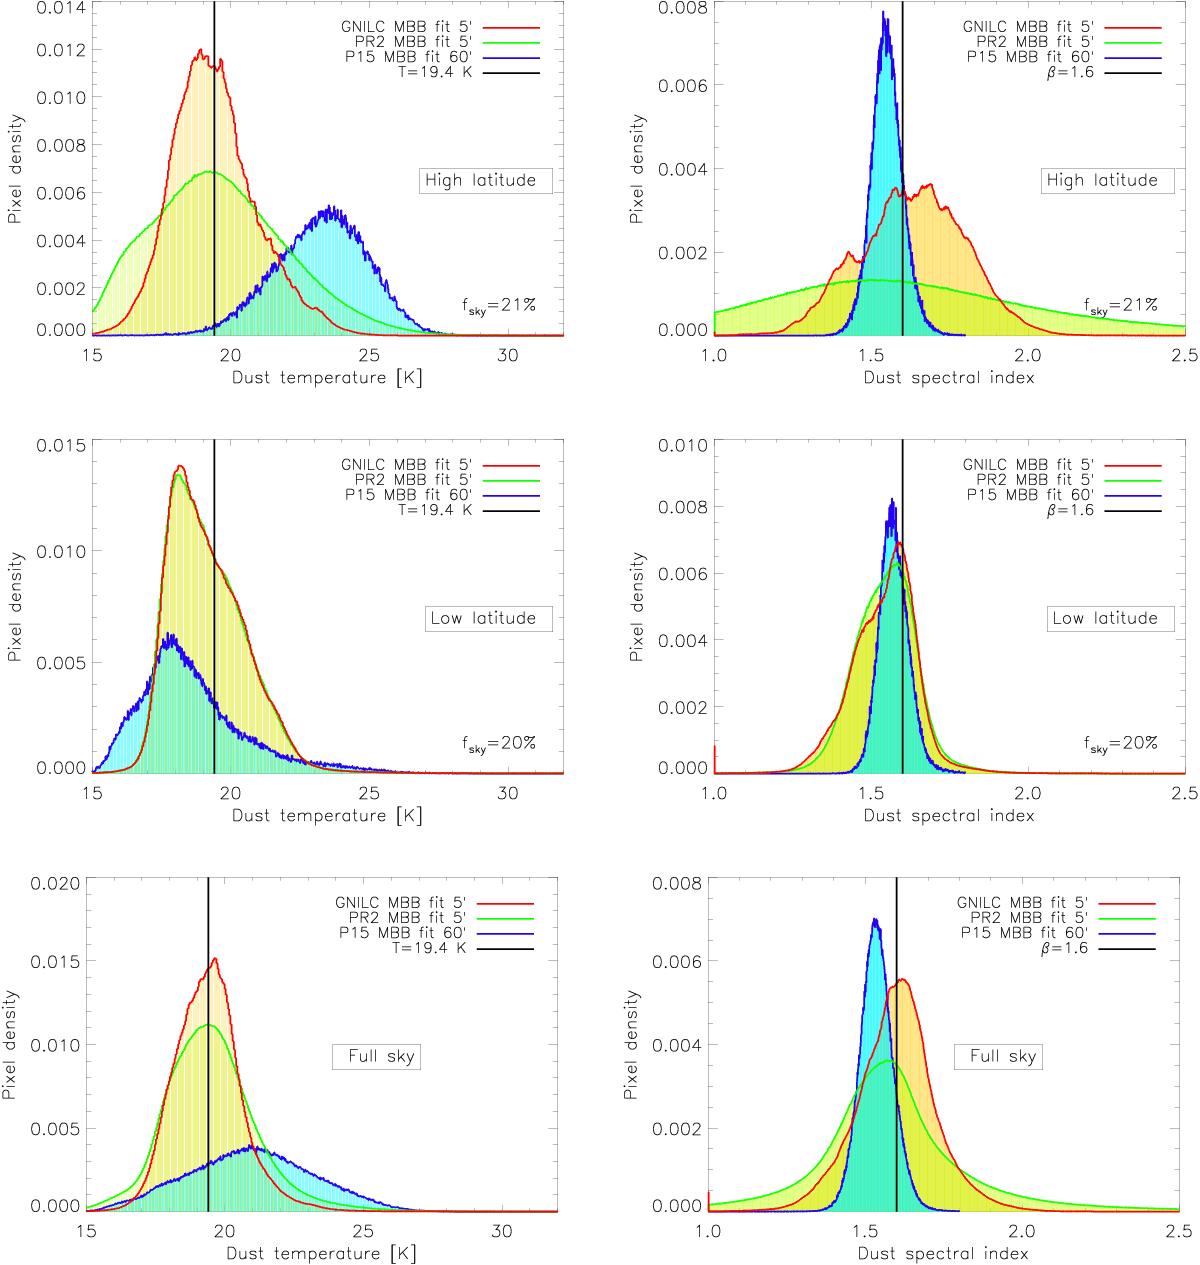
Normalized histograms of Tdust and βdust at 5′ resolution for the GNILC MBB fit (red contours) and the PR2 MBB fit a la model P13 (green contours). The normalized histograms for the dust model P15 (Commander fit at 60′ resolution) are overplotted (blue contours). The histograms are computed from the subset of pixels corresponding to either the high-latitude area in the sky with fsky = 21% (upper panels), the low-latitude area in the sky with fsky = 20% (middle panels), or the whole sky (lower panels). Due to CIB contamination at high-latitude, the PR2 MBB fits show larger dispersion than the GNILC MBB fits in the distributions of Tdust and βdust.
Current usage metrics show cumulative count of Article Views (full-text article views including HTML views, PDF and ePub downloads, according to the available data) and Abstracts Views on Vision4Press platform.
Data correspond to usage on the plateform after 2015. The current usage metrics is available 48-96 hours after online publication and is updated daily on week days.
Initial download of the metrics may take a while.