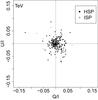
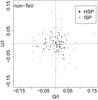
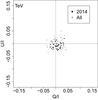
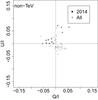
Fig. 8

Top: stacked Q/I vs. U/I plot for the TeV (left) and non-TeV (right) samples. Bottom: same for three TeV sources (left) and two non-TeV sources (right) for which we have data over multiple seasons. The stacking is performed by shifting the mass center of each source to the origin. In the bottom panel we stacked the data based on the mass center of all data, which is why the top and bottom panels are not exactly the same for the 2014 data.
Current usage metrics show cumulative count of Article Views (full-text article views including HTML views, PDF and ePub downloads, according to the available data) and Abstracts Views on Vision4Press platform.
Data correspond to usage on the plateform after 2015. The current usage metrics is available 48-96 hours after online publication and is updated daily on week days.
Initial download of the metrics may take a while.