Free Access
Fig. 4
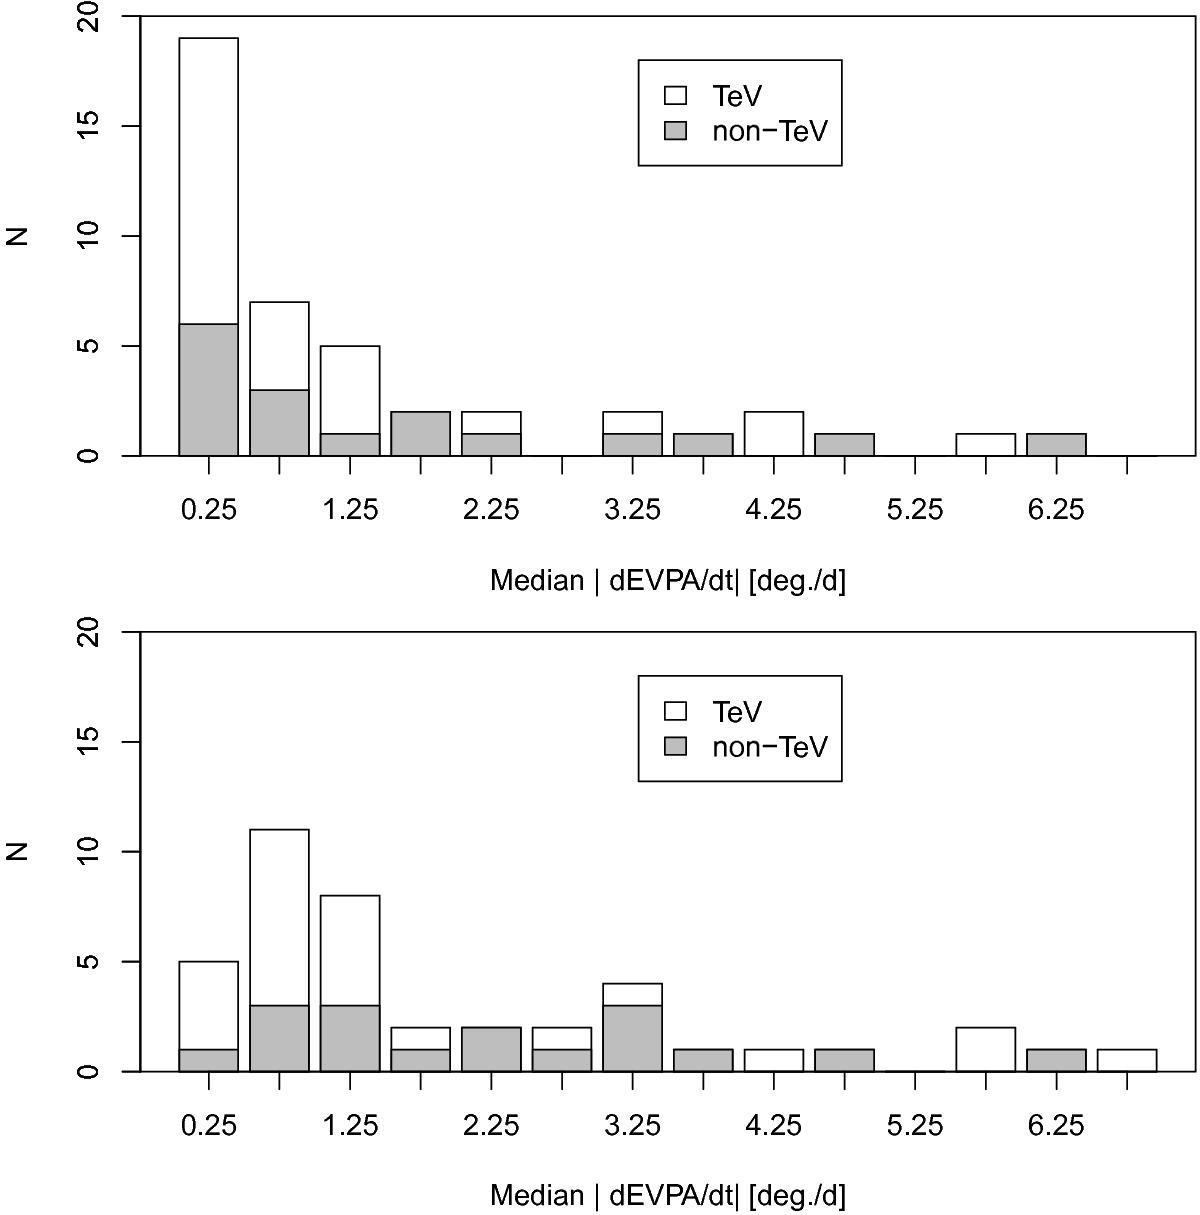
Stacked histogram of the median EVPA derivative for the TeV (white) and non-TeV (gray) samples. Top panel: shows the distribution when the derivative is set to zero for insignificant changes and the bottom panel shows the same when insignificant changes are ignored (see text for details).
Current usage metrics show cumulative count of Article Views (full-text article views including HTML views, PDF and ePub downloads, according to the available data) and Abstracts Views on Vision4Press platform.
Data correspond to usage on the plateform after 2015. The current usage metrics is available 48-96 hours after online publication and is updated daily on week days.
Initial download of the metrics may take a while.