Free Access
Fig. 2
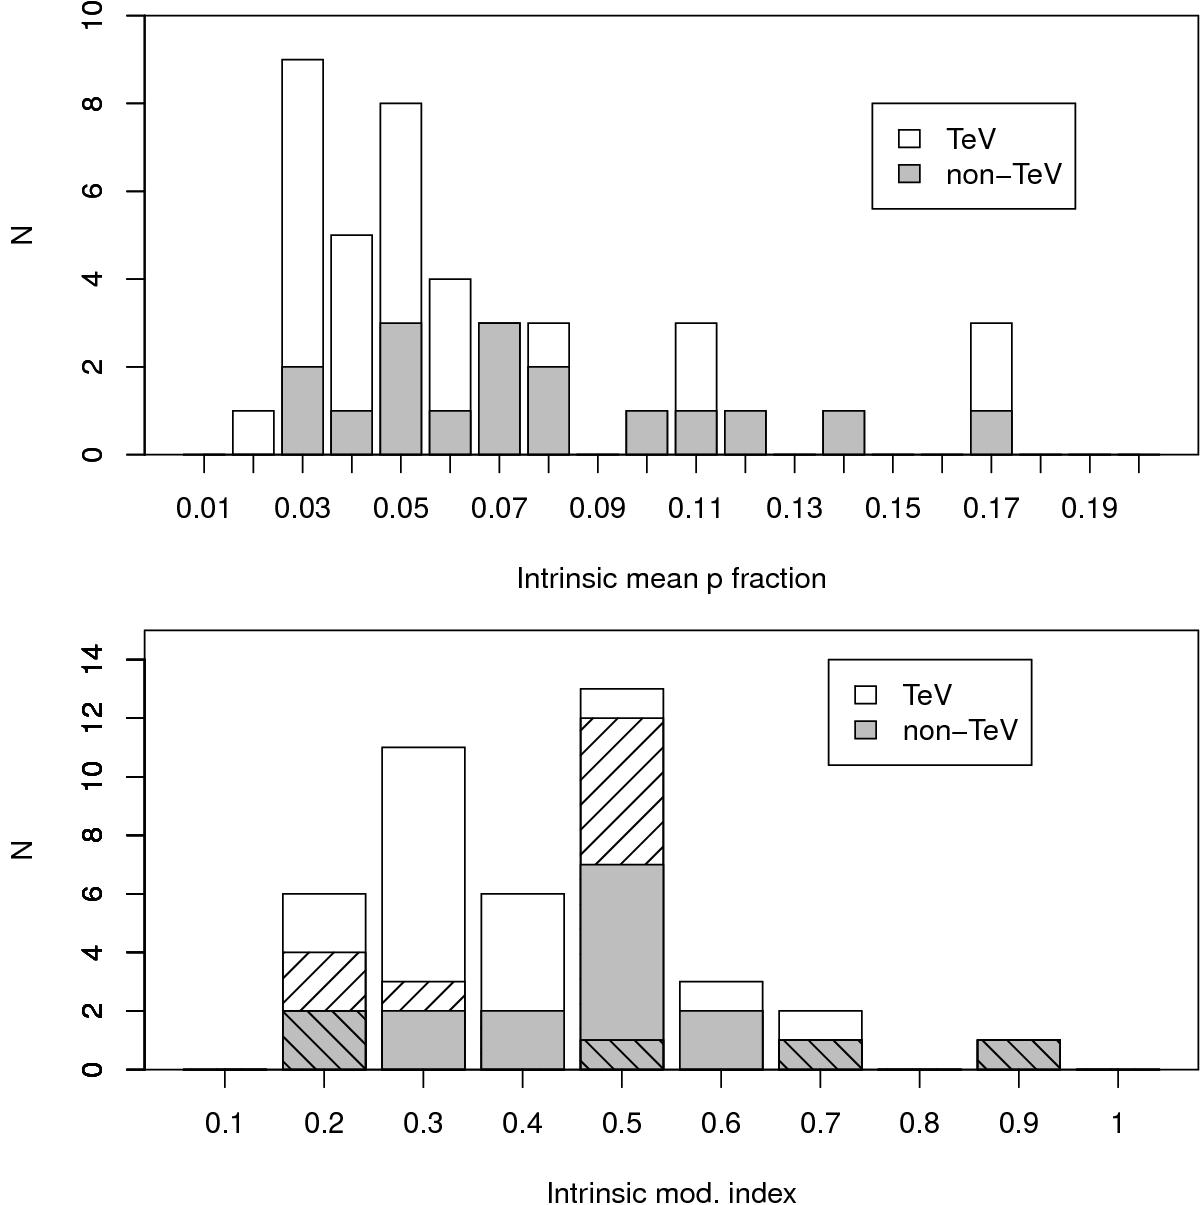
Top: stacked histogram of the intrinsic mean polarization fraction in the TeV (white) and non-TeV (gray) samples. Bottom: stacked histogram of the intrinsic modulation index in the TeV (white) and non-TeV (gray) samples. The hatched bars show the fraction of TeV or non-TeV sources that have only 2σ upper limits available.
Current usage metrics show cumulative count of Article Views (full-text article views including HTML views, PDF and ePub downloads, according to the available data) and Abstracts Views on Vision4Press platform.
Data correspond to usage on the plateform after 2015. The current usage metrics is available 48-96 hours after online publication and is updated daily on week days.
Initial download of the metrics may take a while.