Fig. 10
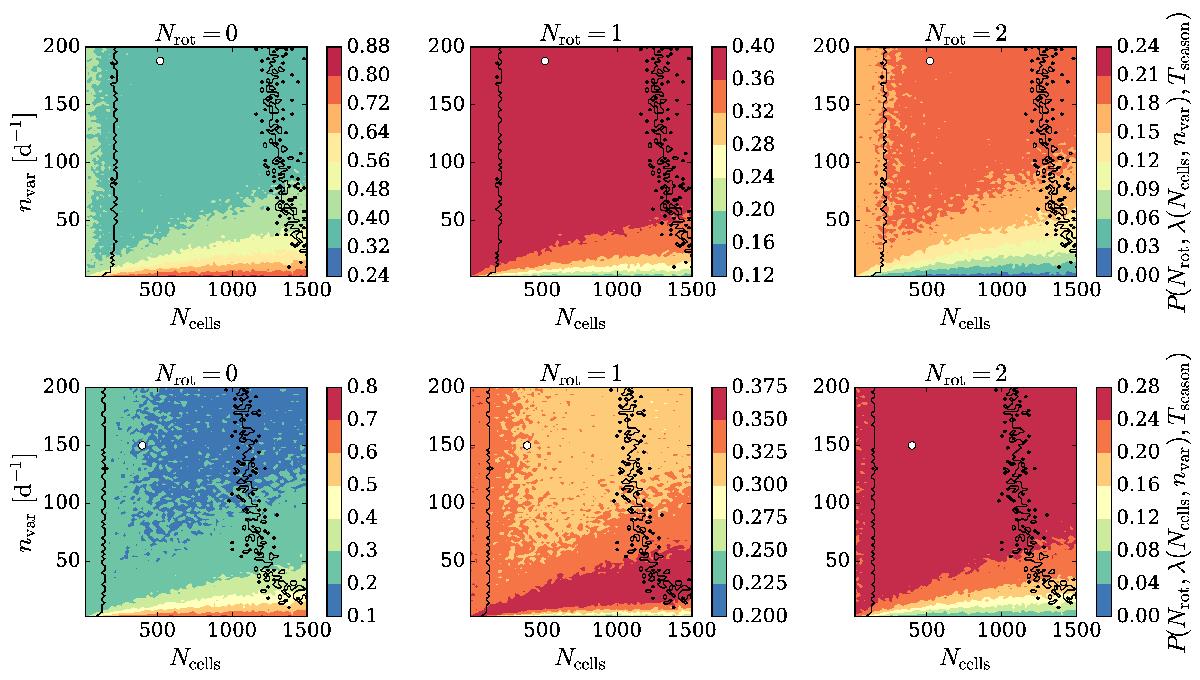
Probability of observing n = 0,1,2 observations during our observing season for the TeV source RGB J0136+391 (top) and the non-TeV source GB6 J1037+5711 (bottom). The color scale shows the probability for a various set of parameters nvar and Ncells. The white dot indicates the best-fit region for obtaining a similar polarization fraction as in the observed light curve and the black curves show its 95% confidence interval.
Current usage metrics show cumulative count of Article Views (full-text article views including HTML views, PDF and ePub downloads, according to the available data) and Abstracts Views on Vision4Press platform.
Data correspond to usage on the plateform after 2015. The current usage metrics is available 48-96 hours after online publication and is updated daily on week days.
Initial download of the metrics may take a while.