| Issue |
A&A
Volume 596, December 2016
|
|
|---|---|---|
| Article Number | A23 | |
| Number of page(s) | 8 | |
| Section | Extragalactic astronomy | |
| DOI | https://doi.org/10.1051/0004-6361/201628969 | |
| Published online | 23 November 2016 | |
Stellar systems in the direction of the Hickson Compact Group 44
I. Low surface brightness galaxies
1 Consejo Nacional de Investigaciones Científicas y Técnicas, Godoy Cruz 2290, C1425FQB, CABA, Argentina
e-mail: asmith@fcaglp.unlp.edu.ar
2 Instituto de Astrofísica de La Plata, UNLP, CONICET, Facultad de Ciencias Astronómicas y Geofísicas, Paseo del Bosque s/n, B1900FWA, La Plata, Argentina
3 Facultad de Ciencias Astronómicas y Geofísicas, Universidad Nacional de La Plata, Paseo del Bosque s/n, B1900FWA, La Plata, Argentina
Received: 19 May 2016
Accepted: 30 August 2016
Context. In spite of the numerous studies of low-luminosity galaxies in different environments, there is still no consensus about their formation scenario. In particular, a large number of galaxies displaying extremely low-surface brightnesses have been detected in the last year, and the nature of these objects is under discussion.
Aims. In this paper we report the detection of two extended low-surface brightness (LSB) objects (μeffg′ ≃ 27 mag) found, in projection, next to NGC 3193 and in the zone of the Hickson Compact Group (HCG) 44, respectively.
Methods. We analyzed deep, high-quality, GEMINI-GMOS images with ELLIPSE within IRAF in order to obtain their brightness profiles and structural parameters. We also searched for the presence of globular clusters (GC) in these fields.
Results. We have found that, if these LSB galaxies were at the distances of NGC 3193 and HCG 44, they would show sizes and luminosities similar to those of the ultra-diffuse galaxies (UDGs) found in the Coma cluster and other associations. In that case, their sizes would be rather larger than those displayed by the Local Group dwarf spheroidal (dSph) galaxies. We have detected a few unresolved sources in the sky zone occupied by these galaxies showing colors and brightnesses typical of blue globular clusters.
Conclusions. From the comparison of the properties of the galaxies presented in this work with those of similar objects reported in the literature, we have found that LSB galaxies display sizes covering a quite extended continous range (reff ~ 0.3−4.5 kpc), in contrast to “normal” early-type galaxies, which show reff ~ 1.0 kpc with a low dispersion. This fact might point to different formation processes for both types of galaxies.
Key words: methods: observational / techniques: photometric / galaxies: groups: individual: HCG 44 / galaxies: dwarf / galaxies: star clusters: general
© ESO, 2016
1. Introduction
Despite the numerous studies of low-mass galaxies performed through observations and numerical simulations, their formation scenario is still hotly debated. As an example, in the case of low-mass early-type galaxies located in rich groups and clusters, several authors have claimed that they might be gas-rich disk galaxies entering the cluster and being transformed through the interaction with the intracluster medium (e.g., Kormendy et al. 2009; Janz et al. 2014; Toloba et al. 2015). Some others, however, based on the strong photometric relations defined by early-type galaxies, propose a scenario of in situ formation within the cluster environment (Smith Castelli et al. 2013; Smith et al. 2015). In addition, there is observational and theoretical evidence that supports a third scenario in which low-mass galaxies might arise from the interaction of massive gas-rich galaxies, as bound structures in the filaments or bridges that are formed as a consequence of the encounters (e.g., Hunsberger et al. 1996; Dabringhausen & Kroupa 2013; Duc et al. 2014).
The very faint end of the early-type galaxy population is defined by dwarf spheroidal (dSph) galaxies, which are extended objects displaying extremely low-surface brightnesses and no evidence of star formation. In the last decade, the number of studies of low-surface brightness (LSB) galaxies outside the Local Group (LG) has increased significantly, thanks to the development of detection surveys with amateur telescopes (e.g., Javanmardi et al. 2016), and access to 8-m class telescopes capable of obtaining extremely high-quality deep images that allow us to follow up the objects identified with small telescopes (e.g., Romanowsky et al. 2016). The interest in the identification of new examples of such extremely faint galaxies resides in the fact that they can be used as test-beds for constraining models of galaxy formation. As an example, Λ-cold dark matter (ΛCDM) models produce a larger number of dSph satellites around bright galaxies than observed (the so-called missing satellite problem, e.g., Klypin et al. 1999; Moore et al. 1999), as well as an isotropic distribution around the brightest galaxies which is not detected in the LG and M 81 (Pawlowski et al. 2013; Chiboucas et al. 2013). In addition, hierarchical models predict dark matter (DM) dominated dSph galaxies, while faint galaxies of tidal origin would not contain DM at all (Dabringhausen & Kroupa 2013, and references therein).
HCG 44 was originally classified as a Hickson Compact Group dominated by an elliptical galaxy (NGC 3193 or HCG 44b), with three additional bright galaxy members: an Sa galaxy (NGC 3189/3190 or HCG 44a), an SBc galaxy (NGC 3185 or HCG 44c) and an Sd galaxy (NGC 3187 or HCG 44d) (Hickson 1982; Hickson et al. 1989). Later, Williams et al. (1991) identified the dwarf-like galaxy [WMv91] 1015+2203 at the redshift of the group, and Borthakur et al. 2010 detected four additional members in their HI study of the group, increasing the HCG 44 galaxy population to nine members. However, Tonry et al. (2001) obtained a surface brightness fluctuation (SBF) distance of 34 Mpc to NGC 3193 and, more recently, Serra et al. (2013) have considered [WMv91] 1015+2203 as a background galaxy due to its radial velocity (Vr = 1940 km s-1), which is larger than that of the group (Vr = 1379 km s-1). In addition, in their spectroscopic study of the active galactic nuclei activity in Hickson Compact Groups, Martínez et al. (2010) reconsidered NGC 3193 as a member of HCG 44. Therefore, the real galaxy content of HCG 44 is still under discussion.
In this paper we present a photometric study of two low-surface brightness galaxies detected in the zone of HCG 44. One is located, in projection, within the halo of NGC 3193, and the other, between the galaxies NGC 3189/3190 and NGC 3185. We analyze their structural properties considering the distance modulii reported in the literature for the bright galaxies placed in this region of the sky (Table 1), without attempting to clarify the membership status of the latter to the HCG 44. The paper is organized as follows. In Sect. 2 we describe the photometric data, in Sect. 3 we present the results obtained from the analysis of these data, in Sect. 4 we analyze the existence of globular clusters associated with these galaxies, and in Sect. 5 we present our conclusions.
Distance information of the bright galaxies present in the region of the HCG 44.
2. Observational data
In semester 2010B we have obtained, with the Gemini Multi-Object Spectrograph (GMOS; Hook et al. 2004) of GEMINI-North (Program: GN-2010B-Q-29, PI: A. Smith Castelli), g′, r′, i′ and z′ images of NGC 3193, and of one field between NGC 3189/3190 and NGC 3185, in the zone of the HCG 44 (Fig. 1). The instrument consists of 3 CCDs of 2048 × 4096 pixels, separated by gaps of ~2.8 arcsec, with an unbinned pixel scale of 0.0727 arcsec pixel-1. The field of view (FOV) is 5.5′ × 5.5′ and the scale for binning 2 × 2 is 0.146 arcsec pixel-1. In Table 2 we show the information related to the GEMINI-GMOS images.
Log of the GEMINI-GMOS images.
We performed spatial dithering between the individual exposures of the fields in order to facilitate the removal of cosmic rays and to fill in the gaps between the CCD chips. The raw images were processed using the GMOS package within IRAF (e.g. gprepare, gbias, giflat, gireduce and gmosaic). The appropriate bias and flat-field images were obtained from the Gemini Science Archive (GSA) as part of the standard GMOS baseline calibrations. The images taken in the filter z′ show significant fringing patterns which were removed by subtracting a master fringe frame that was created using gifringe and girmfringe tasks. The resulting images corresponding to the same filter and the same field, were co-added using the task imcoadd in order to obtain the final images used for further analysis. The photometric data obtained from them were later calibrated to the photometric system of the Sloan Digital Sky Survey (SDSS).
We detected two LSB structures in our Gemini frames, observable in the four filters. With the aim at confirming the existence of both LSB structures, we downloaded g′,r′,i′,z′ images of the same regions of the sky from the database of the SDSS Data Release 12 (DR12; Alam et al. 2015). The SDSS camera consists of 30 2048 × 2048 SITe/Tektronix 49.2 mm square CCDs, which provide a FOV of 13.51 × 8.98 arcmin and a scale of 0.396 arcsec pixel-1. The integration time of these images is 54 s. In Fig. 1 we show the location of the two dSph candidates in a SDSS mosaic. In Fig. 2 we show the images of the low-surface brightness galaxies, both from SDSS and Gemini frames. It can be seen that both LSB objects are detectable in both sets of images.
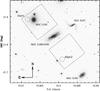 |
Fig. 1 19.7 × 18.3 arcmin mosaic in the g′ filter from SDSS DR12 showing the sky region of HCG 44. The black rectangles depict the two Gemini-GMOS frames used in this work (~5.5 arcmin on a side). The black circles indicate the location of the two dSph candidates. North is up and east to the left. |
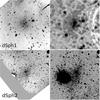 |
Fig. 2 GEMINI-GMOS (left) and SDSS DR12 (right) g′ images of the LSB galaxies located, in projection, within the halo of NGC 3193 (top, 90.3 arcsec on a side; dSph1) and between NGC 3189/3190 and NGC 3185 (bottom, 250 arcsec on a side; dSph2). For clarity, we added level contours in the case of the SDSS image of dSph1. The images of SDSS DR12 have been processed with the IRAF task boxcar considering a box of 10 × 10 pixels. As in Fig. 1, North is up and East to the left. |
3. Results
3.1. DSph galaxy in the halo of NGC 3193
In order to obtain the brightness profiles of both LSB galaxies, we worked with ELLIPSE within IRAF on the GEMINI-GMOS sky-subtracted images. In the particular case of the object within the halo of NGC 3193 (hereafter dSph1; top panels in Fig. 2), we first modeled the bright elliptical galaxy, the halo of which covers the whole frame, and subtracted it from the original images. In the galaxy-subtracted images, we modeled the light of the bright star located next to the elliptical. This model was later subtracted from the original images, and these star-subtracted images were used to obtain the final model of the elliptical galaxy. The images over which we worked to obtain the profiles of the LSB object were the star-galaxy-subtracted ones.
To model dSph1, we masked all the objects in the images and we used a fixed center, ellipticity and position angle, keeping the ellipticity almost circular (ϵ = 0.05). Once we obtained the final table of parameters, we corrected the sky level by constructing curves of growth, that is, we plotted the integrated flux within the different apertures versus the semimajor axis of the apertures. The correction to the sky level of an image is the value for which these curves display an asymptotic flat behavior to infinity. Therefore, we added or subtracted different constant values (smaller than two per cent of the original estimated level) to the integrated fluxes until we got asymptotically flat curves. These corrected fluxes provided the final g′, r′, i′ , and z′ surface brightness profiles shown in the upper panel of Fig. 3. They are extinction corrected using the values provided by the NASA/IPAC Extragalactic Database (NED) from the work of Schlafly & Finkbeiner (2011). We inform the reader that the r′ and i′ frames are affected by strong bleeding patterns due to a bright star. Therefore, the brightnesses in these filters should be taken with caution.
In the case of dSph1, the curves of growth of the different filters stabilize at an equivalent radius1req ~ 26.0 arcsec. Therefore, we will take this radius as the total equivalent radius of the galaxy, and as the aperture within which we will measure its total integrated magnitudes. The surface brightness reached at this aperture is μg′ ~ 30 mag arcsec-2.
If we assume that this LSB object is located at the distance of NGC 3193 (D = 33.6 Mpc, Tully et al. 2013), we have a physical scale of 0.163 kpc arcsec-1 and the total projected radius of this galaxy would be 4.2 kpc. If this galaxy were at the distance of HCG 44 (we will assume a mean distance of D = 23.6 Mpc, (m−M) = 31.86, from those of NGC 3185 and NGC 3189/3190 shown in Table 1) the physical scale would be 0.115 kpc arcsec-1 and the radius would translate into 3.0 kpc.
The projected separation between dSph1 and NGC 3193 is 1.4 arcmin (13.7 kpc at the distance of NGC 3193). The separation between dSph1 and NGC 3189/3190 is ~6.8 arcmin (46.9 kpc at the distance of HCG 44).
The brightness profiles of dSph1 are rather noisy and they display extremely low signal-to-noise ratio (S/N = 1.4 per binned pixel in the inner zone of the g′ profile). Therefore, instead of performing a numerical integration of the brightness profile, we will take as an approach to the total integrated magnitudes the magnitudes obtained from the total flux of the stabilized curve of growth. These magnitudes are listed in Table 3. To estimate the errors in the magnitudes, we followed the procedure used by Cellone et al. (1994) and Cellone (1999) in their studies of LSB galaxies in the Fornax cluster and NGC 5044 group. We evaluated the variations of the background near the galaxy by fitting a surface to the mean sky value. In the case of dSph1, we found that these variations are ~0.2% of that value. As this value was similar to that of the mean error in the sky, we changed the curves of growth by adding and subtracting this amount of sky value, and calculated the upper and lower limits of the total magnitudes from these new curves of growth.
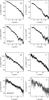 |
Fig. 3 Extinction corrected g′, r′, i′ and z′ surface brightness profiles of dSph1 (top) and dSph2 (bottom). |
Considering the effective radius as the equivalent radius that contains half of the total flux of the galaxy, we obtain reff ~ 11.5 arcsec. Depending on the distance considered to the galaxy, this translates into reff ~ 1.9 kpc (NGC 3193) or reff ~ 1.3 kpc (HCG 44). According to Fig. 4, if dSph1 were indeed at the distance of NGC 3193 or HCG 44, its reff would be in agreement with those of the “ultra-diffuse galaxies” (UDGs) reported by van Dokkum et al. (2015) in the Coma cluster, and it would be quite large in comparison to those reported for most of the LG dSphs (McConnachie 2012, and references therein). Figure 5, on the other hand, shows that this object, shifted to the Virgo cluster distance, would not follow the red-sequence (RS) of Virgo’s early-type galaxies, in contrast with the UDGs reported by Koda et al. (2015) in Coma which do follow Coma’s RS.
We built a model of the galaxy through the IRAF task bmodel. Its subtraction from the galaxy-star subtracted images left no residuals, which indicates the absence of star-forming regions, internal substructures, or distorted isophotes, which would be evidence of interaction.
3.2. DSph galaxy between NGC 3189/3190 and NGC 3185
After performing several tests, and due to the extremely low surface brightness of the galaxy (S/N = 0.5 per binned pixel in the inner zone of the g′ profile), we fixed circular isophotes to obtain the brightness profile of the dSph galaxy located within the HCG 44 region (hereafter dSph2; lower panels of Fig. 2). As in the case of dSph1, we worked on sky-subtracted images in which we masked all the extended and unresolved objects, and we built the curve of growth in order to correct the initially assumed sky value. In this case, the curve of growth in the g′ filter stabilizes at req ~ 54 arcsec (μg′ ~ 30 mag arcsec-2). If the galaxy were located at the distance of the HCG 44, this total equivalent radius would translate into r = 6.2 kpc. In that case, this would imply that this object would be a large LSB galaxy.
We show the extinction corrected brightness profiles in the lower panel of Fig. 3. In this case, as the galaxy is extremely faint, the surface brightness profiles are rather noisy. The integrated magnitudes, obtained from the total flux of the stabilized curve of growth, must be taken with caution and are presented in Table 3. Magnitude errors were obtained in a similar manner to those of the integrated magnitudes of dSph1 (see Sect. 3.1).
The effective radius of dSph2 in the g′ filter is reff ~ 19 arcsec. If dSph2 were indeed at the distance of HCG 44, it would translate into reff ~ 2.2 kpc. Similarly to dSph1, the reff of dSph2 would be in agreement with those reported for Coma’s UDGs and would be significantly larger than those of LG dSphs (Fig. 4), if it were a member of HCG 44. In addition, it would not follow Virgo’s RS.
The projected separation between dSph2 and NGC 3185 is 5.5 arcmin, while the separation between dSph2 and NGC 3189/3190 is 5.6 arcmin. At the distance of the HCG 44, these separations would translate into 37.9 kpc and 38.6 kpc, respectively.
The subtraction of a model of the galaxy from the sky-subtracted images left no residuals which is evidence of the absence of star-formation regions, inner structures, or distorted isophotes. However, as shown in Fig. 6, we detected in the (g′−r′) color map of the GEMINI-GMOS field containing dSph2, what seems to be a LSB structure linking dSph2 to the halo of NGC 3189/3190. This structure displays (g′−r′) ~ 0.33, a similar color to that of the external regions of dSph2. This color is much bluer than those expected if this structure were due to, for example, MW cirrus ((g′−r′) = 1.33−2.03 mag, Ludwig et al. 2012).
Basic information of the LSB objects analyzed in this paper. Apparent magnitudes and colors are not extinction or reddening corrected.
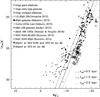 |
Fig. 4 ⟨ μeff ⟩-Luminosity diagram of the early-type galaxies in the central region of the Virgo cluster (Smith Castelli et al. 2013), showing the location of the LSB galaxies presented in this work (assuming they are at the distances of NGC 3193 and/or HCG 44), plus different samples of dSph and ultra-diffuse galaxies reported in the literature. In the case of dSph1, we plot two locations considering the distance modulii of NGC 3193 and HCG 44. |
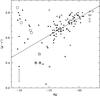 |
Fig. 5 Color−magnitude diagram of the early-type galaxies in the central region of the Virgo cluster (Smith Castelli et al. 2013), showing the location of the dSph galaxies presented in this work (asterisks and open star) assuming they are at the distances of NGC 3193 and/or HCG 44. We also include the galaxies reported by Makarov et al. (2015; filled stars), Müller et al. (2015; filled triangles), and Ludwig et al. (2012; big open circles). The symbols code for Virgo galaxies is the same as in Fig. 4. The big vertical error bar represents the mean error in (g′−r′) (0.05 mag) for all galaxies included in the plot, excepting the LSB galaxies reported in this work. |
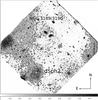 |
Fig. 6 (g′−r′) Color map of the GEMINI-GMOS field (5.5 × 5.5 arcmin) containing dSph2. We can see that there seems to be a LSB structure linking dSph2 to the halo of NGC 3189/3190. This structure displays a similar color to that of the external regions of dSph2 ((g′−r′) ~ 0.33). This might be evidence of a tidal origin for dSph2. As in Fig. 1, north is up and east to the left. |
4. Globular clusters?
Globular clusters (GCs) are stellar systems believed to be formed during the first stages of the formation of their host galaxies. They are considered as good examples of single stellar populations and, therefore, they are expected to provide information about the processes experienced by the galaxies in which they reside.
Our images have been obtained with the intention of studying the population of GCs within the HCG 44 (Faifer et al., in prep.). With this in mind, we searched for GC candidates in the neighborhoods of dSph1 and dSph2. To this aim, we performed point spread function (PSF) photometry in both fields. As a next step, we selected GC candidates according to the stellarity index provided by SExtractor (Bertin & Arnouts 1996), taking 0.5 as the value that separates resolved from unresolved sources. Finally, from colors presented by Forte et al. (2013), we adopted the following ranges to select GC candidates:
0.0 < (r′−i′) < 0.50.4 < (g′−r′) < 0.90.5 < (g′−i′) < 1.50.7 < (g′−z′) < 1.70.1 < (r′−z′) < 1.021.0 <i′< 24.0.
The upper brightness limit in the i′ filter is taken considering that the completeness experiments show that the sample is complete for i′< 24 mag. The lower limit implies that we are including as GC candidates all objects with Mi′> −12 mag (Faifer et al. 2011). It is worth mentioning that selecting GC candidates from high-quality images (FWHM< 1 arcsec) by using different color indeces has provided very clean samples as shown by the spectroscopic studies by Bridges et al. (2006) and Pierce et al. (2006).
4.1. GC candidates around dSph1
As mentioned in the previous sections, dSph1 is located, in projection, within the halo of the bright elliptical galaxy NGC 3193, which shows a rich GC system. dSph1 is located at a projected distance of 1.4 arcmin from the elliptical. Therefore, it is hard to certainly identify a GC population linked to this LSB object. The mean density of GC candidates at that galactocentric distance is 14 objects arcmin-2. In the left panel of Fig. 7, we show a Gemini-GMOS image of 2.0 × 2.0 arcmin centered on dSph1, where we depict with circles the GC candidates identified in the zone.
We are not able to detect an over-density around dSph1, but this is expected from the low number of GCs reported for low-luminosity galaxies (Georgiev et al. 2010). Therefore, as a tentative approach, we defined an area where we expected to find some genuine GC of dSph1. To this aim, we selected the area inside the circle of radii rtot (see Table 3). There are three candidates which fill the color and magnitude selection previously mentioned (black circles). Besides these, there are four unresolved and quite bright objects with g′ = 23−23.8 mag, which appear over-imposed to dSph1. Unfortunately, we are not able to obtain (g′−r′) and (g′−i′) colors for two of them as a consequence of a strong bleeding pattern in the r′ and i′ frames due to a bright star present in the field (white circles in Fig. 7). However, for two of them, it was possible to obtain (g′−z′) colors (small black circles in Fig. 7).
In Table 4 we show the basic information extracted for the unresolved objects we detected in the region occupied by dSph1. We can see that all of the sources with measured colors show typical values of metal-poor GCs (i.e., blue GCs). It is worth mentioning that GCs confirmed in low-mass galaxies are mainly blue globulars (Sharina et al. 2005). Furthermore, the objects observed over-imposed to dSph1 would be rather bright sources (MV< −9 mag) at the distances of NGC 3193 or HCG 44. Therefore, if dSph1 were located at these distances, these unresolved objects might be nuclear massive clusters similar to those reported in other dSph galaxies (e.g., Puzia & Sharina 2008; Georgiev et al. 2009).
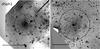 |
Fig. 7 Same GEMINI-GMOS g′ images shown in Fig. 2, but now showing the location of the GC candidates within the fields (rhomboids), and the GC candidates located within the total radii of the dSph galaxies (small circles). The big circles in both images depict the total radii measured for the galaxies. The white circles in the field of dSph1 are GC candidates with no (g′−r′) and (g′−i′) color information due to a strong bleeding pattern caused by a near, bright star. The horizontal bars depict a scale of 1 arcmin in each frame. As in Fig. 1, north is up and east to the left. |
Basic information of the unresolved sources detected in the sky region occupied by dSph1.
Basic information of the unresolved sources detected in the sky region occupied by dSph2.
4.2. GC candidates around dSph2
DSph2 is more distant from the bright galaxies present in the region of HCG 44 than dSph1. Therefore, the object density in the zone is lower (1.08 object arcmin-2) than that of the neighborhoods of dSph1. In the right panel of Fig. 7 we can see that, within a radius equal to the equivalent radius of dSph2, there are six unresolved sources with colors similar to those of GCs. As in the case of dSph1, no over-density associated with the galaxy can be detected.
As shown in Table 5, all the detected objects would be blue GCs, similar to those found in the frames of dSph1. From a nearby control field, we have estimated that the expected contamination in the zone of HCG 44 is 0.3 object arcmin-2. These blue GC candidates might belong to NGC 3189/3190, or to dSph2 if this galaxy were located at the distance of HCG 44. In the latter case, they would show an asymmetric distribution, similar to those found in other dSph galaxies (e.g., Tudorica et al. 2015; Beasley et al. 2016; Peng & Lim 2016).
5. Discussion and conclusions
From deep GEMINI-GMOS images, we have detected two extended LSB objects in the region of the HCG 44. From our photometric analysis we have found the following results:
-
Both galaxies display smooth morphologies. The subtraction of models of the galaxies built from elliptical isophotes with fixed parameters, left no residuals. This might be evidence of the absence of inner structures, star-forming regions, and interactions with the brighter galaxies.
-
The colors of these objects are in agreement with those reported for the dSphs studied by Makarov et al. (2015). However, they are much bluer than those of the LSB galaxies detected in M 83 (Müller et al. 2015) and those of the dSph galaxies analyzed by Ludwig et al. (2012) around NGC 7331.
-
If both galaxies were placed at the distances of NGC 3193 and HCG 44, the effective radius and luminosities of both objects would be similar to those of the ultra-diffuse galaxies (UDGs) reported in different environments. These sizes would be significantly larger than those of the dSph galaxies of the LG (McConnachie 2012) and of the LSB galaxies recently identified in the M 83 subgroup in Centaurus (Müller et al. 2015).
-
If dSph1 were at the distance of NGC 3193, it would be one of the most extended LSB objects reported up to date.
-
If the LSB structure that seems to link dSph2 with NGC 3189/3190 is real, it would be evidence of a tidal origin for dSph2.
-
We have detected several unresolved sources in the frames of dSph1 and dSph2 consistent with being blue GCs, but we have not detected any over-density that could be associated to either of the two galaxies. However, if dSph1 and dSph2 were low-mass galaxies at the distances of NGC 3193 and/or HCG 44, we would not expect a high number of GCs belonging to them. If the unresolved objects were indeed GCs, and dSph1 and dSph2 were at such distances, dSph1 might contain massive nuclear star clusters like those reported by Georgiev et al. (2009) in several dSph galaxies, and the distribution of the GCs of dSph2 would be asymmetric like that shown by the IKN dwarf in the M 81 group (Tudorica et al. 2015).
-
As we are not able to establish the distances to dSph1 and dSph2, the hypothesis that these objects were isolated LSB galaxies could not be discarded.
According to the “Dual Dwarf Galaxy Theorem” postulated by Kroupa (2012), two types of dwarf galaxies exist: “primordial dwarf galaxies”, formed within low-mass dark matter halos, that, as a consequence, are dark matter (DM) dominated; and “tidal/ram-pressure stripped dwarfs”, formed in the encounters of galaxies, which are devoid of DM. An interesting general result obtained from Fig. 4 is that LSB galaxies display a quite extended range of effective radii, in comparison with “normal” early-type galaxies which show reff ~ 1.0 kpc with a low dispersion. This different behavior might point to different formation scenarios for both types of galaxies.
In the context of the discussion on whether UDGs are failed luminous galaxies or genuine dwarfs (van Dokkum et al. 2015; Beasley & Trujillo 2016), if the unresolved objects detected in the frames of dSph1 and dSph2 are indeed GCs belonging to these galaxies, both galaxies would be in agreement with the scenario of Beasley & Trujillo (2016). That is, they would be quenched dwarfs, as all detected unresolved sources would be blue GCs, and failed luminous galaxies are expected to present both red and blue GCs and a richer GC system.
If both dSph galaxies belong to HCG 44, and considering HCG 44 as composed of four galaxies (NGC 3185, NGC 3187, NGC 3189/90, and [WMv91] 1015+2203), then both LSB galaxies would be located in a high-density environment, similar to that of the center of rich-galaxy clusters. In addition, they would constitute ~33% of the total galaxy population of the group, and ~66% of the dwarf-galaxy population. These quantities would be in agreement with the estimations made by Hunsberger et al. (1996) about the amount of dwarf galaxies of tidal origin expected in Hickson Compact Groups.
We hope that the obtention of spectroscopic data of both dSph galaxies and their GC candidates in the near future, will help to disentangle the real nature of all these objects.

Acknowledgments
We thank the anonymous referee for her/his comments and suggestions which helped to improve the content of the paper. We also thank Sergio Cellone for reading the manuscript and providing interesting discussion. Based on observations obtained at the Gemini Observatory (Program GN-2010B-Q-29), which is operated by the Association of Universities for Research in Astronomy, Inc., under a cooperative agreement with the NSF on behalf of the Gemini partnership: the National Science Foundation (United States), the National Research Council (Canada), CONICYT (Chile), the Australian Research Council (Australia), Ministério da Ciência, Tecnologia e Inovação (Brazil) and Ministerio de Ciencia, Tecnología e Innovación Productiva (Argentina). This research has made use of the NASA/IPAC Extragalactic Database (NED) which is operated by the Jet Propulsion Laboratory, California Institute of Technology, under contract with the National Aeronautics and Space Administration. Funding for SDSS-III has been provided by the Alfred P. Sloan Foundation, the Participating Institutions, the National Science Foundation, and the US Department of Energy Office of Science. The SDSS-III web site is http://www.sdss3.org/. SDSS-III is managed by the Astrophysical Research Consortium for the Participating Institutions of the SDSS-III Collaboration including the University of Arizona, the Brazilian Participation Group, Brookhaven National Laboratory, Carnegie Mellon University, University of Florida, the French Participation Group, the German Participation Group, Harvard University, the Instituto de Astrofisica de Canarias, the Michigan State/Notre Dame/JINA Participation Group, Johns Hopkins University, Lawrence Berkeley National Laboratory, Max Planck Institute for Astrophysics, Max Planck Institute for Extraterrestrial Physics, New Mexico State University, New York University, Ohio State University, Pennsylvania State University, University of Portsmouth, Princeton University, the Spanish Participation Group, University of Tokyo, University of Utah, Vanderbilt University, University of Virginia, University of Washington, and Yale University. This work was funded with grants from Consejo Nacional de Investigaciones Científicas y Técnicas and Universidad Nacional de La Plata (Argentina).
References
- Alam, S., Albareti, F. D., Allen de Prieto, C., et al. 2015, ApJS, 219, 12 [NASA ADS] [CrossRef] [Google Scholar]
- Beasley, M. A., & Trujillo, I. 2016, ApJ, 830, 23 [NASA ADS] [CrossRef] [Google Scholar]
- Beasley, M. A., Romanowsky, A. J., Pota, V., et al. 2016, ApJ, 819, L20 [NASA ADS] [CrossRef] [Google Scholar]
- Bertin, E., & Arnouts, S. 1996, A&AS, 117, 393 [NASA ADS] [CrossRef] [EDP Sciences] [Google Scholar]
- Borthakur, S., Yun, M. S., & Verdes-Montenegro, L. 2010, ApJ, 710, 385 [NASA ADS] [CrossRef] [Google Scholar]
- Bridges, T., Gebhardt, K., Sharples, R., et al. 2006, MNRAS, 373, 157 [NASA ADS] [CrossRef] [Google Scholar]
- Cellone, S. A. 1999, A&A, 345, 403 [NASA ADS] [Google Scholar]
- Cellone, S. A., Forte, J. C., & Geisler, D. 1994, ApJS, 93, 397 [NASA ADS] [CrossRef] [Google Scholar]
- Chiboucas, K., Jacobs, B. A., Tully, R. B., & Karachentsev, I. D. 2013, AJ, 146, 126 [NASA ADS] [CrossRef] [Google Scholar]
- Dabringhausen, J., & Kroupa, P. 2013, MNRAS, 429, 1858 [NASA ADS] [CrossRef] [Google Scholar]
- Duc, P.-A., Paudel, S., McDermid, R. M., et al. 2014, MNRAS, 440, 1458 [NASA ADS] [CrossRef] [Google Scholar]
- Faifer, F. R., Forte, J. C., Norris, M. A., et al. 2011, MNRAS, 416, 155 [NASA ADS] [Google Scholar]
- Forte, J. C., Faifer, F. R., Vega, E. I., et al. 2013, MNRAS, 431, 1405 [NASA ADS] [CrossRef] [Google Scholar]
- Georgiev, I. Y., Puzia, T. H., Hilker, M., & Goudfrooij, P. 2009, MNRAS, 392, 879 [NASA ADS] [CrossRef] [MathSciNet] [Google Scholar]
- Georgiev, I. Y., Puzia, T. H., Goudfrooij, P., & Hilker, M. 2010, MNRAS, 406, 1967 [NASA ADS] [Google Scholar]
- Hickson, P. 1982, ApJ, 255, 382 [NASA ADS] [CrossRef] [Google Scholar]
- Hickson, P., Kindl, E., & Auman, J. R. 1989, ApJS, 70, 687 [NASA ADS] [CrossRef] [Google Scholar]
- Hook, I. M., Jørgensen, I., Allington-Smith, J. R., et al. 2004, PASP, 116, 425 [NASA ADS] [CrossRef] [Google Scholar]
- Hunsberger, S. D., Charlton, J. C., & Zaritsky, D. 1996, ApJ, 462, 50 [NASA ADS] [CrossRef] [Google Scholar]
- Janz, J., Laurikainen, E., Lisker, T., et al. 2014, ApJ, 786, 105 [NASA ADS] [CrossRef] [Google Scholar]
- Javanmardi, B., Martinez-Delgado, D., Kroupa, P., et al. 2016, A&A, 588, A89 [NASA ADS] [CrossRef] [EDP Sciences] [Google Scholar]
- Klypin, A., Kravtsov, A. V., Valenzuela, O., & Prada, F. 1999, ApJ, 522, 82 [Google Scholar]
- Koda, J., Yagi, M., Yamanoi, H., & Komiyama, Y. 2015, ApJ, 807, L2 [NASA ADS] [CrossRef] [Google Scholar]
- Kormendy, J., Fisher, D. B., Cornell, M. E., & Bender, R. 2009, ApJS, 182, 216 [NASA ADS] [CrossRef] [Google Scholar]
- Kroupa, P. 2012, PASA, 29, 395 [NASA ADS] [CrossRef] [Google Scholar]
- Ludwig, J., Pasquali, A., Grebel, E. K., & Gallagher, III, J. S. 2012, AJ, 144, 190 [NASA ADS] [CrossRef] [Google Scholar]
- Makarov, D. I., Sharina, M. E., Karachentseva, V. E., & Karachentsev, I. D. 2015, A&A, 581, A82 [NASA ADS] [EDP Sciences] [Google Scholar]
- Martínez, M. A., Del Olmo, A., Coziol, R., & Perea, J. 2010, AJ, 139, 1199 [NASA ADS] [CrossRef] [Google Scholar]
- McConnachie, A. W. 2012, AJ, 144, 4 [NASA ADS] [CrossRef] [Google Scholar]
- Moore, B., Ghigna, S., Governato, F., et al. 1999, ApJ, 524, L19 [Google Scholar]
- Müller, O., Jerjen, H., & Binggeli, B. 2015, A&A, 583, A79 [NASA ADS] [CrossRef] [EDP Sciences] [Google Scholar]
- Pawlowski, M. S., Kroupa, P., & Jerjen, H. 2013, MNRAS, 435, 1928 [NASA ADS] [CrossRef] [Google Scholar]
- Peng, E. W., & Lim, S. 2016, ApJ, 822, L31 [NASA ADS] [CrossRef] [Google Scholar]
- Pierce, M., Beasley, M. A., Forbes, D. A., et al. 2006, MNRAS, 366, 1253 [NASA ADS] [CrossRef] [Google Scholar]
- Puzia, T. H., & Sharina, M. E. 2008, ApJ, 674, 909 [NASA ADS] [CrossRef] [Google Scholar]
- Romanowsky, A. J., Martínez-Delgado, D., Martin, N. F., et al. 2016, MNRAS, 457, L103 [NASA ADS] [CrossRef] [Google Scholar]
- Schlafly, E. F., & Finkbeiner, D. P. 2011, ApJ, 737, 103 [NASA ADS] [CrossRef] [Google Scholar]
- Serra, P., Koribalski, B., Duc, P.-A., et al. 2013, MNRAS, 428, 370 [NASA ADS] [CrossRef] [Google Scholar]
- Sharina, M. E., Puzia, T. H., & Makarov, D. I. 2005, A&A, 442, 85 [NASA ADS] [CrossRef] [EDP Sciences] [Google Scholar]
- Smith, R., Sánchez-Janssen, R., Beasley, M. A., et al. 2015, MNRAS, 454, 2502 [NASA ADS] [CrossRef] [Google Scholar]
- Smith Castelli, A. V., González, N. M., Faifer, F. R., & Forte, J. C. 2013, ApJ, 772, 68 [NASA ADS] [CrossRef] [Google Scholar]
- Theureau, G., Hanski, M. O., Coudreau, N., Hallet, N., & Martin, J.-M. 2007, A&A, 465, 71 [NASA ADS] [CrossRef] [EDP Sciences] [Google Scholar]
- Toloba, E., Guhathakurta, P., Boselli, A., et al. 2015, ApJ, 799, 172 [NASA ADS] [CrossRef] [Google Scholar]
- Tonry, J. L., Dressler, A., Blakeslee, J. P., et al. 2001, ApJ, 546, 681 [NASA ADS] [CrossRef] [Google Scholar]
- Tudorica, A., Georgiev, I. Y., & Chies-Santos, A. L. 2015, A&A, 581, A84 [NASA ADS] [CrossRef] [EDP Sciences] [Google Scholar]
- Tully, R. B., Courtois, H. M., Dolphin, A. E., et al. 2013, AJ, 146, 86 [NASA ADS] [CrossRef] [Google Scholar]
- van Dokkum, P. G., Abraham, R., Merritt, A., et al. 2015, ApJ, 798, L45 [NASA ADS] [CrossRef] [Google Scholar]
- Williams, B. A., McMahon, P. M., & van Gorkom, J. H. 1991, AJ, 101, 1957 [NASA ADS] [CrossRef] [Google Scholar]
All Tables
Basic information of the LSB objects analyzed in this paper. Apparent magnitudes and colors are not extinction or reddening corrected.
Basic information of the unresolved sources detected in the sky region occupied by dSph1.
Basic information of the unresolved sources detected in the sky region occupied by dSph2.
All Figures
|
Fig. 1 19.7 × 18.3 arcmin mosaic in the g′ filter from SDSS DR12 showing the sky region of HCG 44. The black rectangles depict the two Gemini-GMOS frames used in this work (~5.5 arcmin on a side). The black circles indicate the location of the two dSph candidates. North is up and east to the left. |
| In the text | |
|
Fig. 2 GEMINI-GMOS (left) and SDSS DR12 (right) g′ images of the LSB galaxies located, in projection, within the halo of NGC 3193 (top, 90.3 arcsec on a side; dSph1) and between NGC 3189/3190 and NGC 3185 (bottom, 250 arcsec on a side; dSph2). For clarity, we added level contours in the case of the SDSS image of dSph1. The images of SDSS DR12 have been processed with the IRAF task boxcar considering a box of 10 × 10 pixels. As in Fig. 1, North is up and East to the left. |
| In the text | |
|
Fig. 3 Extinction corrected g′, r′, i′ and z′ surface brightness profiles of dSph1 (top) and dSph2 (bottom). |
| In the text | |
|
Fig. 4 ⟨ μeff ⟩-Luminosity diagram of the early-type galaxies in the central region of the Virgo cluster (Smith Castelli et al. 2013), showing the location of the LSB galaxies presented in this work (assuming they are at the distances of NGC 3193 and/or HCG 44), plus different samples of dSph and ultra-diffuse galaxies reported in the literature. In the case of dSph1, we plot two locations considering the distance modulii of NGC 3193 and HCG 44. |
| In the text | |
|
Fig. 5 Color−magnitude diagram of the early-type galaxies in the central region of the Virgo cluster (Smith Castelli et al. 2013), showing the location of the dSph galaxies presented in this work (asterisks and open star) assuming they are at the distances of NGC 3193 and/or HCG 44. We also include the galaxies reported by Makarov et al. (2015; filled stars), Müller et al. (2015; filled triangles), and Ludwig et al. (2012; big open circles). The symbols code for Virgo galaxies is the same as in Fig. 4. The big vertical error bar represents the mean error in (g′−r′) (0.05 mag) for all galaxies included in the plot, excepting the LSB galaxies reported in this work. |
| In the text | |
|
Fig. 6 (g′−r′) Color map of the GEMINI-GMOS field (5.5 × 5.5 arcmin) containing dSph2. We can see that there seems to be a LSB structure linking dSph2 to the halo of NGC 3189/3190. This structure displays a similar color to that of the external regions of dSph2 ((g′−r′) ~ 0.33). This might be evidence of a tidal origin for dSph2. As in Fig. 1, north is up and east to the left. |
| In the text | |
|
Fig. 7 Same GEMINI-GMOS g′ images shown in Fig. 2, but now showing the location of the GC candidates within the fields (rhomboids), and the GC candidates located within the total radii of the dSph galaxies (small circles). The big circles in both images depict the total radii measured for the galaxies. The white circles in the field of dSph1 are GC candidates with no (g′−r′) and (g′−i′) color information due to a strong bleeding pattern caused by a near, bright star. The horizontal bars depict a scale of 1 arcmin in each frame. As in Fig. 1, north is up and east to the left. |
| In the text | |
Current usage metrics show cumulative count of Article Views (full-text article views including HTML views, PDF and ePub downloads, according to the available data) and Abstracts Views on Vision4Press platform.
Data correspond to usage on the plateform after 2015. The current usage metrics is available 48-96 hours after online publication and is updated daily on week days.
Initial download of the metrics may take a while.