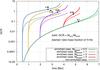
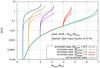
Fig. 6

Top: evolution of the gas-to-core ratio and total mass fraction of H-He of the planets for different Mthresh (in Earth masses, indicated with different colours in the inset). The black dots on each curve indicate the time when the runaway of gas starts, and the numbers above are the corresponding GCR at that time. Bottom: same as above, but as a function of the core mass.
Current usage metrics show cumulative count of Article Views (full-text article views including HTML views, PDF and ePub downloads, according to the available data) and Abstracts Views on Vision4Press platform.
Data correspond to usage on the plateform after 2015. The current usage metrics is available 48-96 hours after online publication and is updated daily on week days.
Initial download of the metrics may take a while.