Fig. 3
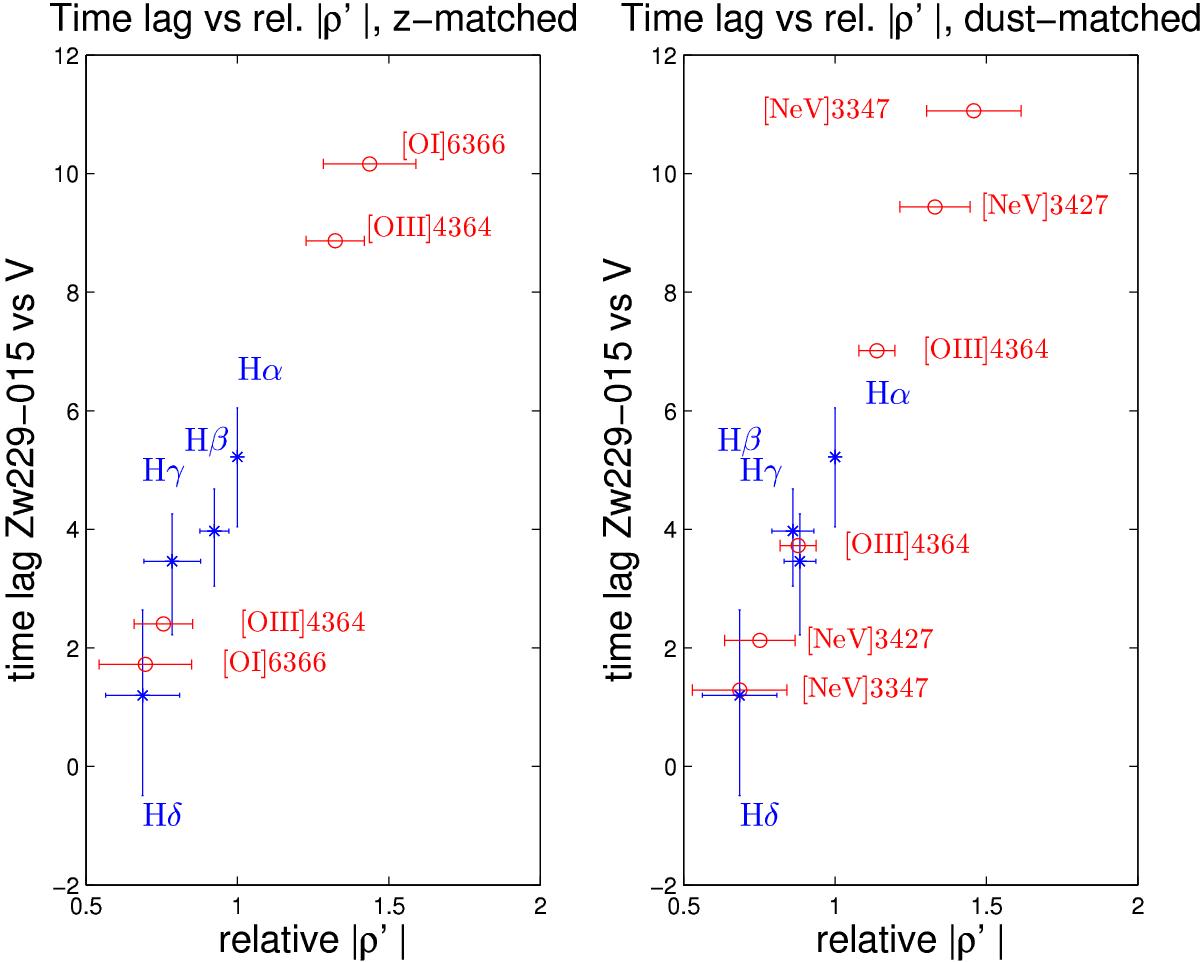
CoCoA and time lags in Zw229-015. The relative CoCoA strengths versus the time lags for the Seyfert-1 galaxy Zw229-015 from Barth et al. (2011) are plotted. From the time lags we know the slowest line is Hα. We use it as our reference point and plot time lags of Hα, Hβ, Hγ and Hδ versus the ρ′(Hα) for the same lines. The left panel shows the results for redshift-matched Seyfert-1 galaxies (148 objects), the right panel shows the results for dust-matched Seyfert-1 galaxies (87 objects). Blue star symbols show the measured results, their errors representing standard deviations of the mean values. Assuming a linear trend, we also predict time lags for other lines with no time lag information but large | ρ′|, shown with red circles. As | ρ′ | only is relative to Hα, the first option is | ρ′ | × τcent(Hα) and the second (1/| ρ′ | ) × τcent(Hα). In the left panel, we predict the double-option time lags for [O i]6366 and [O iii]4364. In the right panel, we predict the double options for expected time lags for [O iii]4364 and the two [Ne v]3347, 3427 lines. For the left panel, the red circles show the predicted double possibilities for time lags for [O i]6366 and [O iii]4364. For the right panel, the red circles show the predicted double possibilities for [O iii]4364, [Ne v]3347 and [Ne v]3427. Starting from | ρ′ | = 1 and outwards, we note that the double options are always plotted outwards having the same size on their errorbar.
Current usage metrics show cumulative count of Article Views (full-text article views including HTML views, PDF and ePub downloads, according to the available data) and Abstracts Views on Vision4Press platform.
Data correspond to usage on the plateform after 2015. The current usage metrics is available 48-96 hours after online publication and is updated daily on week days.
Initial download of the metrics may take a while.