Fig. 2
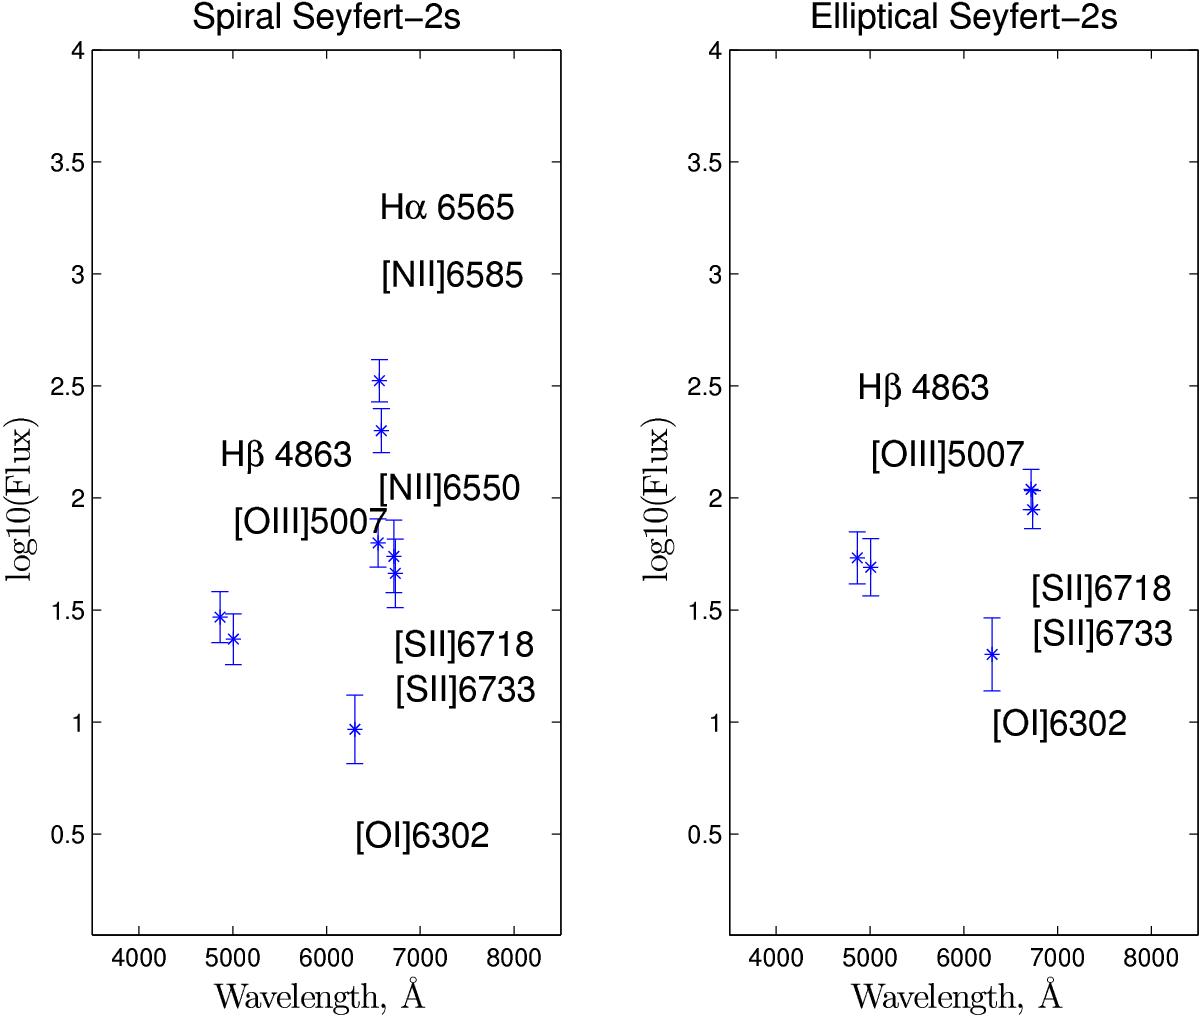
Fluxes of emission-lines in CoCoA group 2. The left graph shows CoCoA group 2 fluxes with 3σ error bars for 163 Seyfert-2s in spiral hosts. The right graph shows CoCoA group 2 fluxes for 163 Seyfert-2s in elliptical hosts, selected to match the first sample in redshift and Balmer decrement Hα/Hβ. The fluxes are in units of 10-17 erg/s/cm2.
Current usage metrics show cumulative count of Article Views (full-text article views including HTML views, PDF and ePub downloads, according to the available data) and Abstracts Views on Vision4Press platform.
Data correspond to usage on the plateform after 2015. The current usage metrics is available 48-96 hours after online publication and is updated daily on week days.
Initial download of the metrics may take a while.