Fig. 4
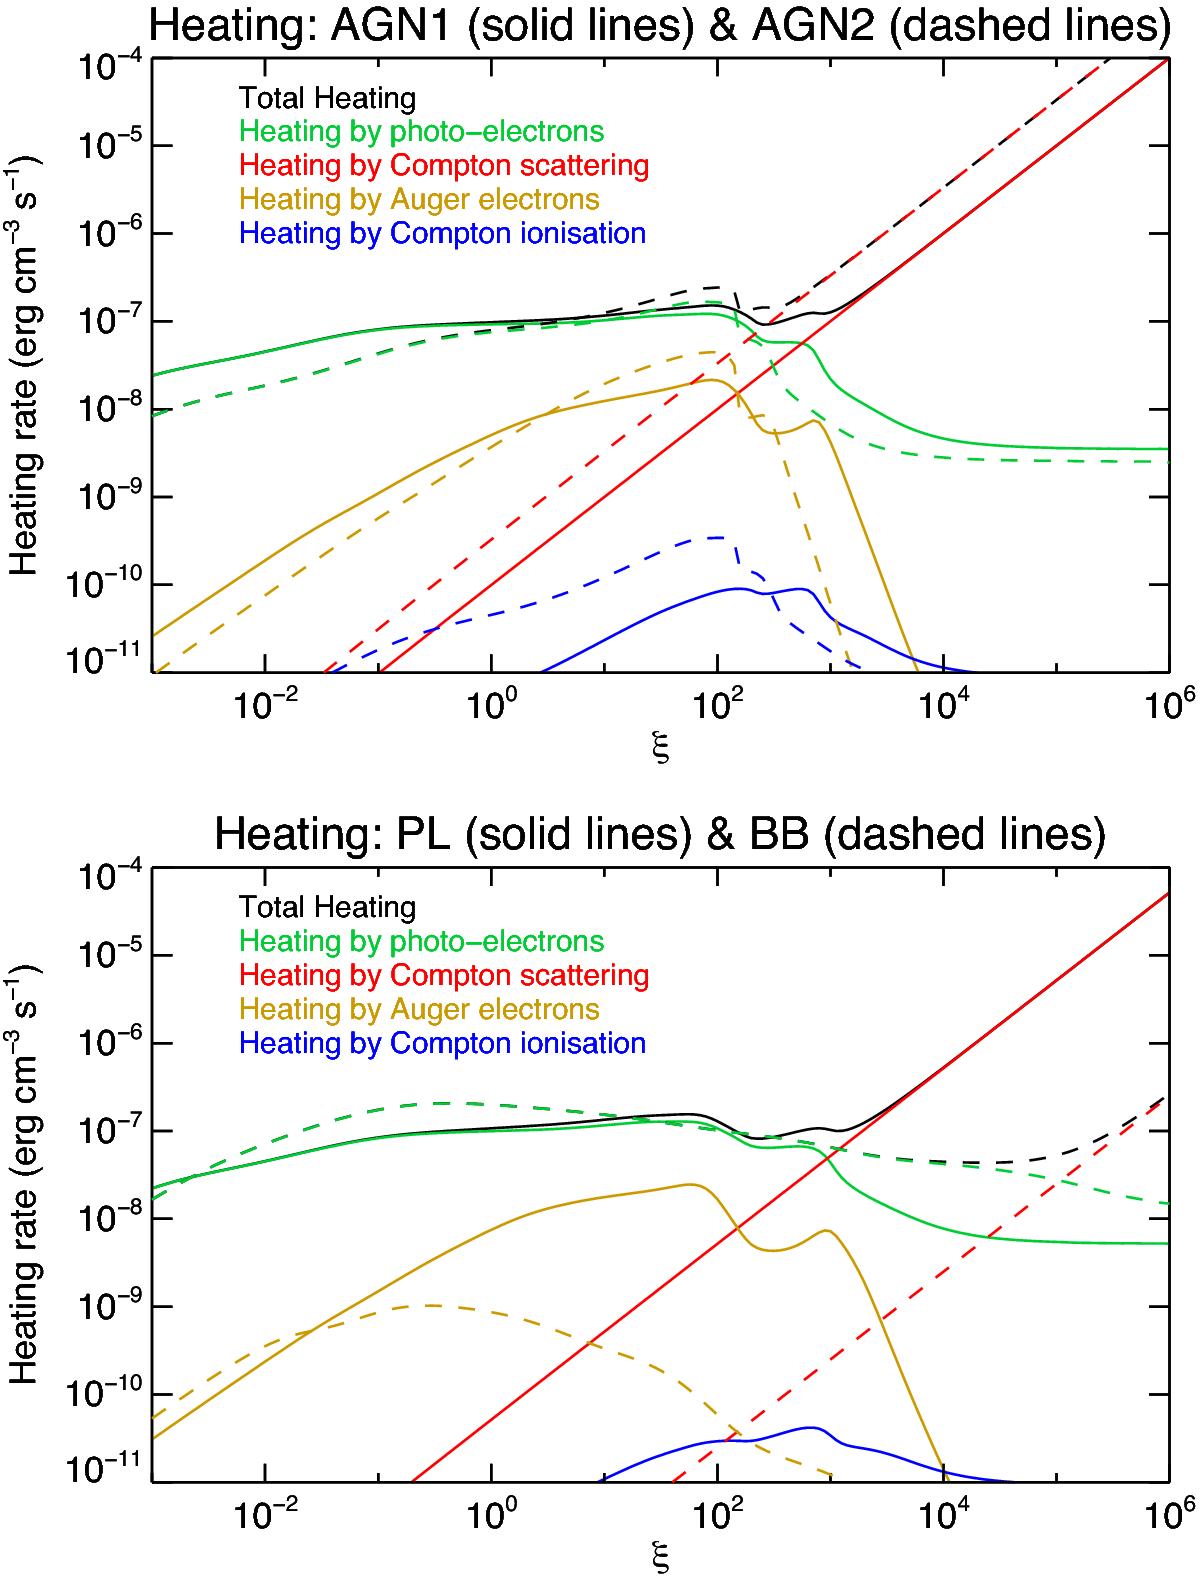
Heating rate in a PIE plasma as a function of ionisation parameter ξ for the AGN1 and AGN2 SEDs (top panel), and the PL and BB SEDs (bottom panel). The curves corresponding to AGN1 and PL are shown in solid lines, and those corresponding to AGN2 and BB are indicated with dashed lines. For each case, the total heating rate is shown in black, and the contributions from individual processes are shown in the same colours as their corresponding labels.
Current usage metrics show cumulative count of Article Views (full-text article views including HTML views, PDF and ePub downloads, according to the available data) and Abstracts Views on Vision4Press platform.
Data correspond to usage on the plateform after 2015. The current usage metrics is available 48-96 hours after online publication and is updated daily on week days.
Initial download of the metrics may take a while.