Fig. 3
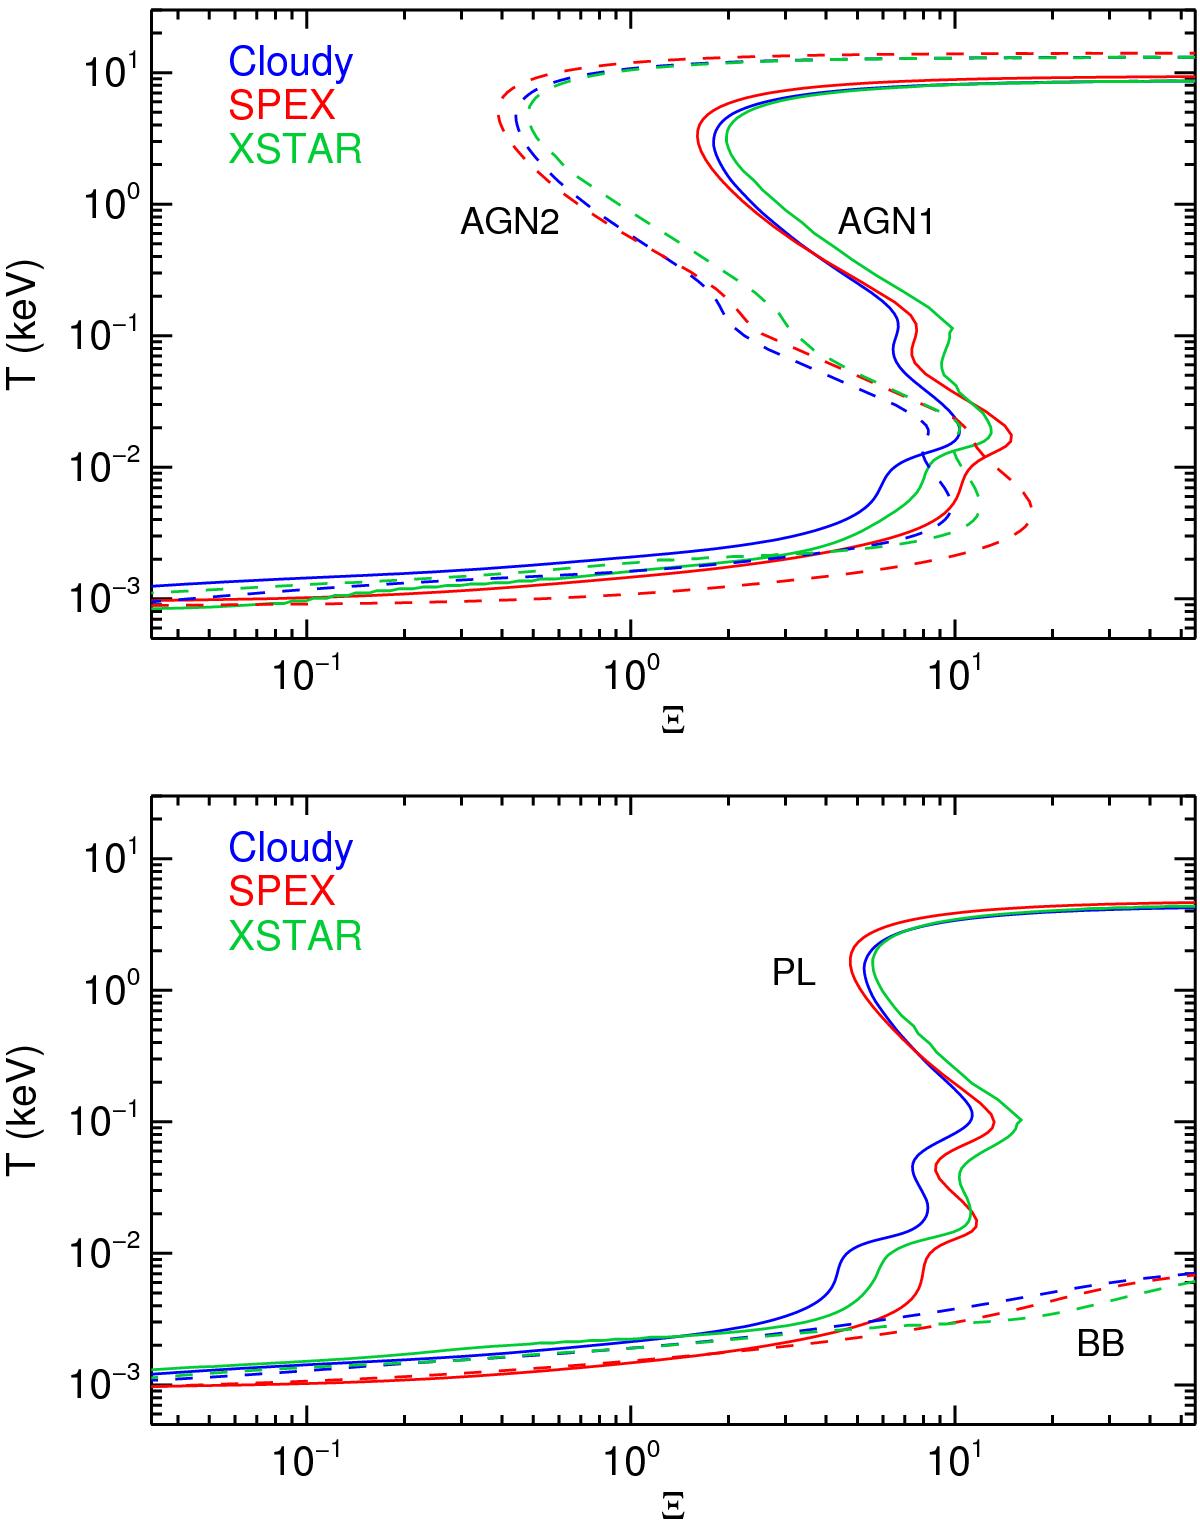
Electron temperature T of a PIE plasma as a function of the pressure form of the ionisation parameter Ξ. The curves are calculated using the Cloudy, SPEX, and XSTAR photoionisation codes, shown in blue, red, and green, respectively. The calculations are carried out for the four different SEDs of Fig. 1: AGN1 (top panel in solid line), AGN2 (top panel in dashed line), PL (bottom panel in solid line), and BB (bottom panel in dashed line).
Current usage metrics show cumulative count of Article Views (full-text article views including HTML views, PDF and ePub downloads, according to the available data) and Abstracts Views on Vision4Press platform.
Data correspond to usage on the plateform after 2015. The current usage metrics is available 48-96 hours after online publication and is updated daily on week days.
Initial download of the metrics may take a while.