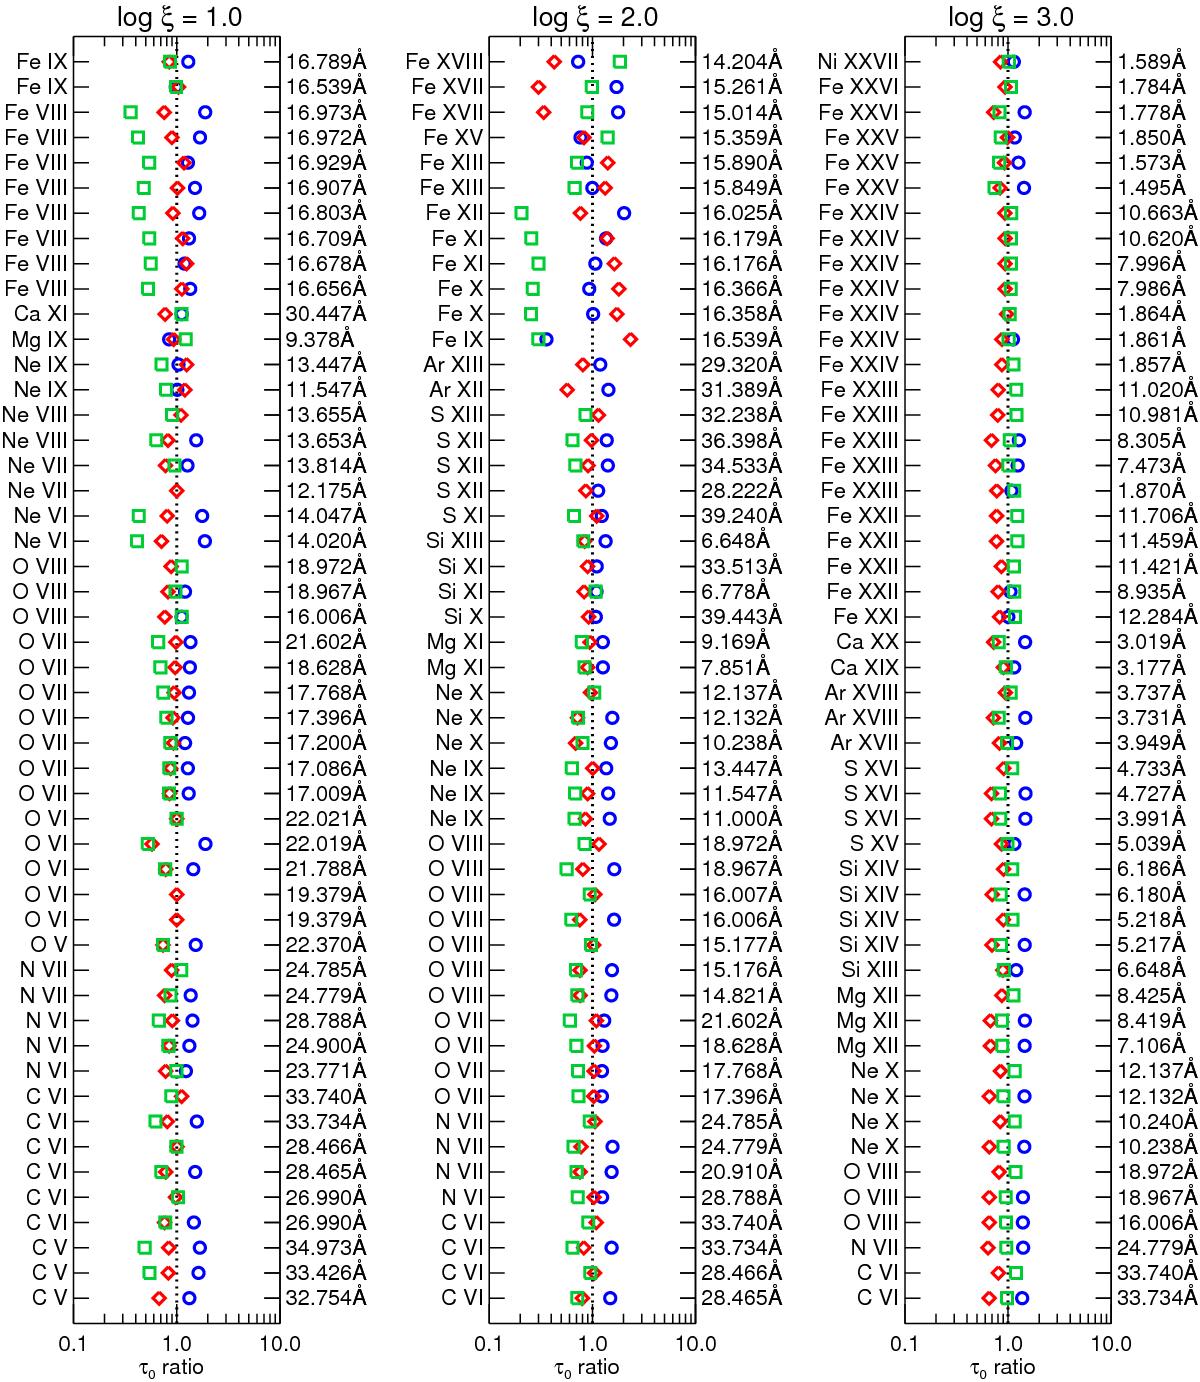
Fig. 8
Comparison of the optical depth τ0 of the strongest X-ray absorption lines at wavelengths below 40 Å (energies above 0.3 keV), from Cloudy, SPEX, and XSTAR calculations for a PIE plasma, ionised by the AGN1 SED, with NH = 1 × 1022 cm-2 and σv = 200 km s-1. The displayed data give the ratio of τ0 from each code relative to the mean τ0 found by the codes. The τ0 ratio is shown in blue circles for Cloudy, red diamonds for SPEX, and green squares for XSTAR. The listed lines correspond to the 50 lines with the highest τ0 values at log ξ of 1.0 (left panel), 2.0 (middle panel), and 3.0 (right panel). The dotted vertical line at τ0 ratio of 1 indicates where the results from the codes would be identical.
Current usage metrics show cumulative count of Article Views (full-text article views including HTML views, PDF and ePub downloads, according to the available data) and Abstracts Views on Vision4Press platform.
Data correspond to usage on the plateform after 2015. The current usage metrics is available 48-96 hours after online publication and is updated daily on week days.
Initial download of the metrics may take a while.