Fig. 14
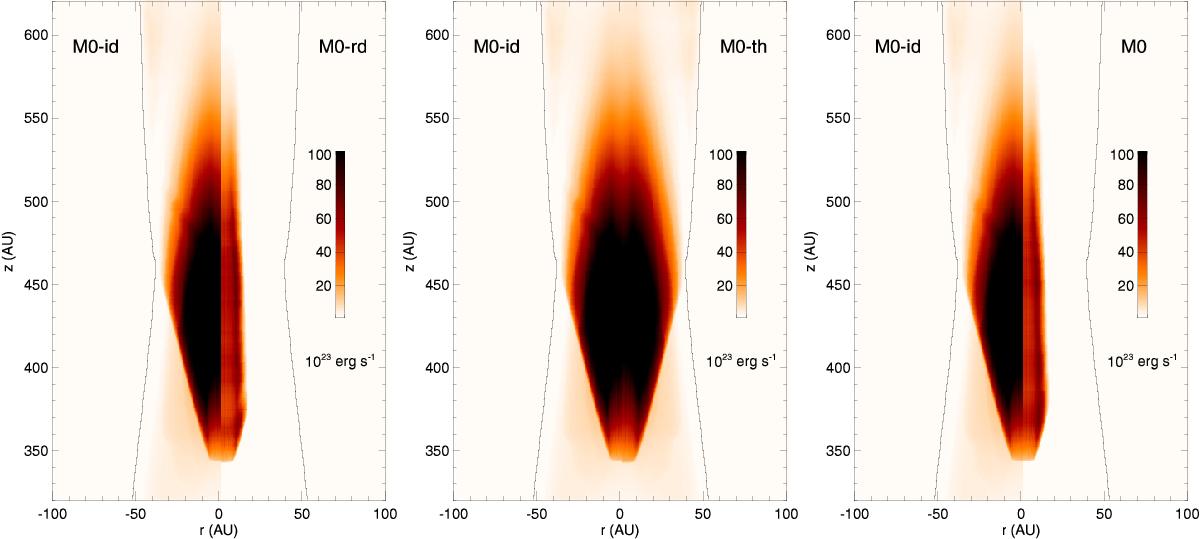
Spatial distribution of the X-ray emission after ≈50 yr of evolution. Different models are compared: M0-rd (the model with radiative cooling) right half-panel on the left, M0-th (the model with thermal conduction) right half-panel in the middle, and M0 (the reference case) right half-panel on the right. The X-ray distribution for the model M0-id is shown in each left half-panel.
Current usage metrics show cumulative count of Article Views (full-text article views including HTML views, PDF and ePub downloads, according to the available data) and Abstracts Views on Vision4Press platform.
Data correspond to usage on the plateform after 2015. The current usage metrics is available 48-96 hours after online publication and is updated daily on week days.
Initial download of the metrics may take a while.