Free Access
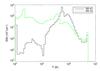
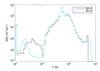
Fig. 12
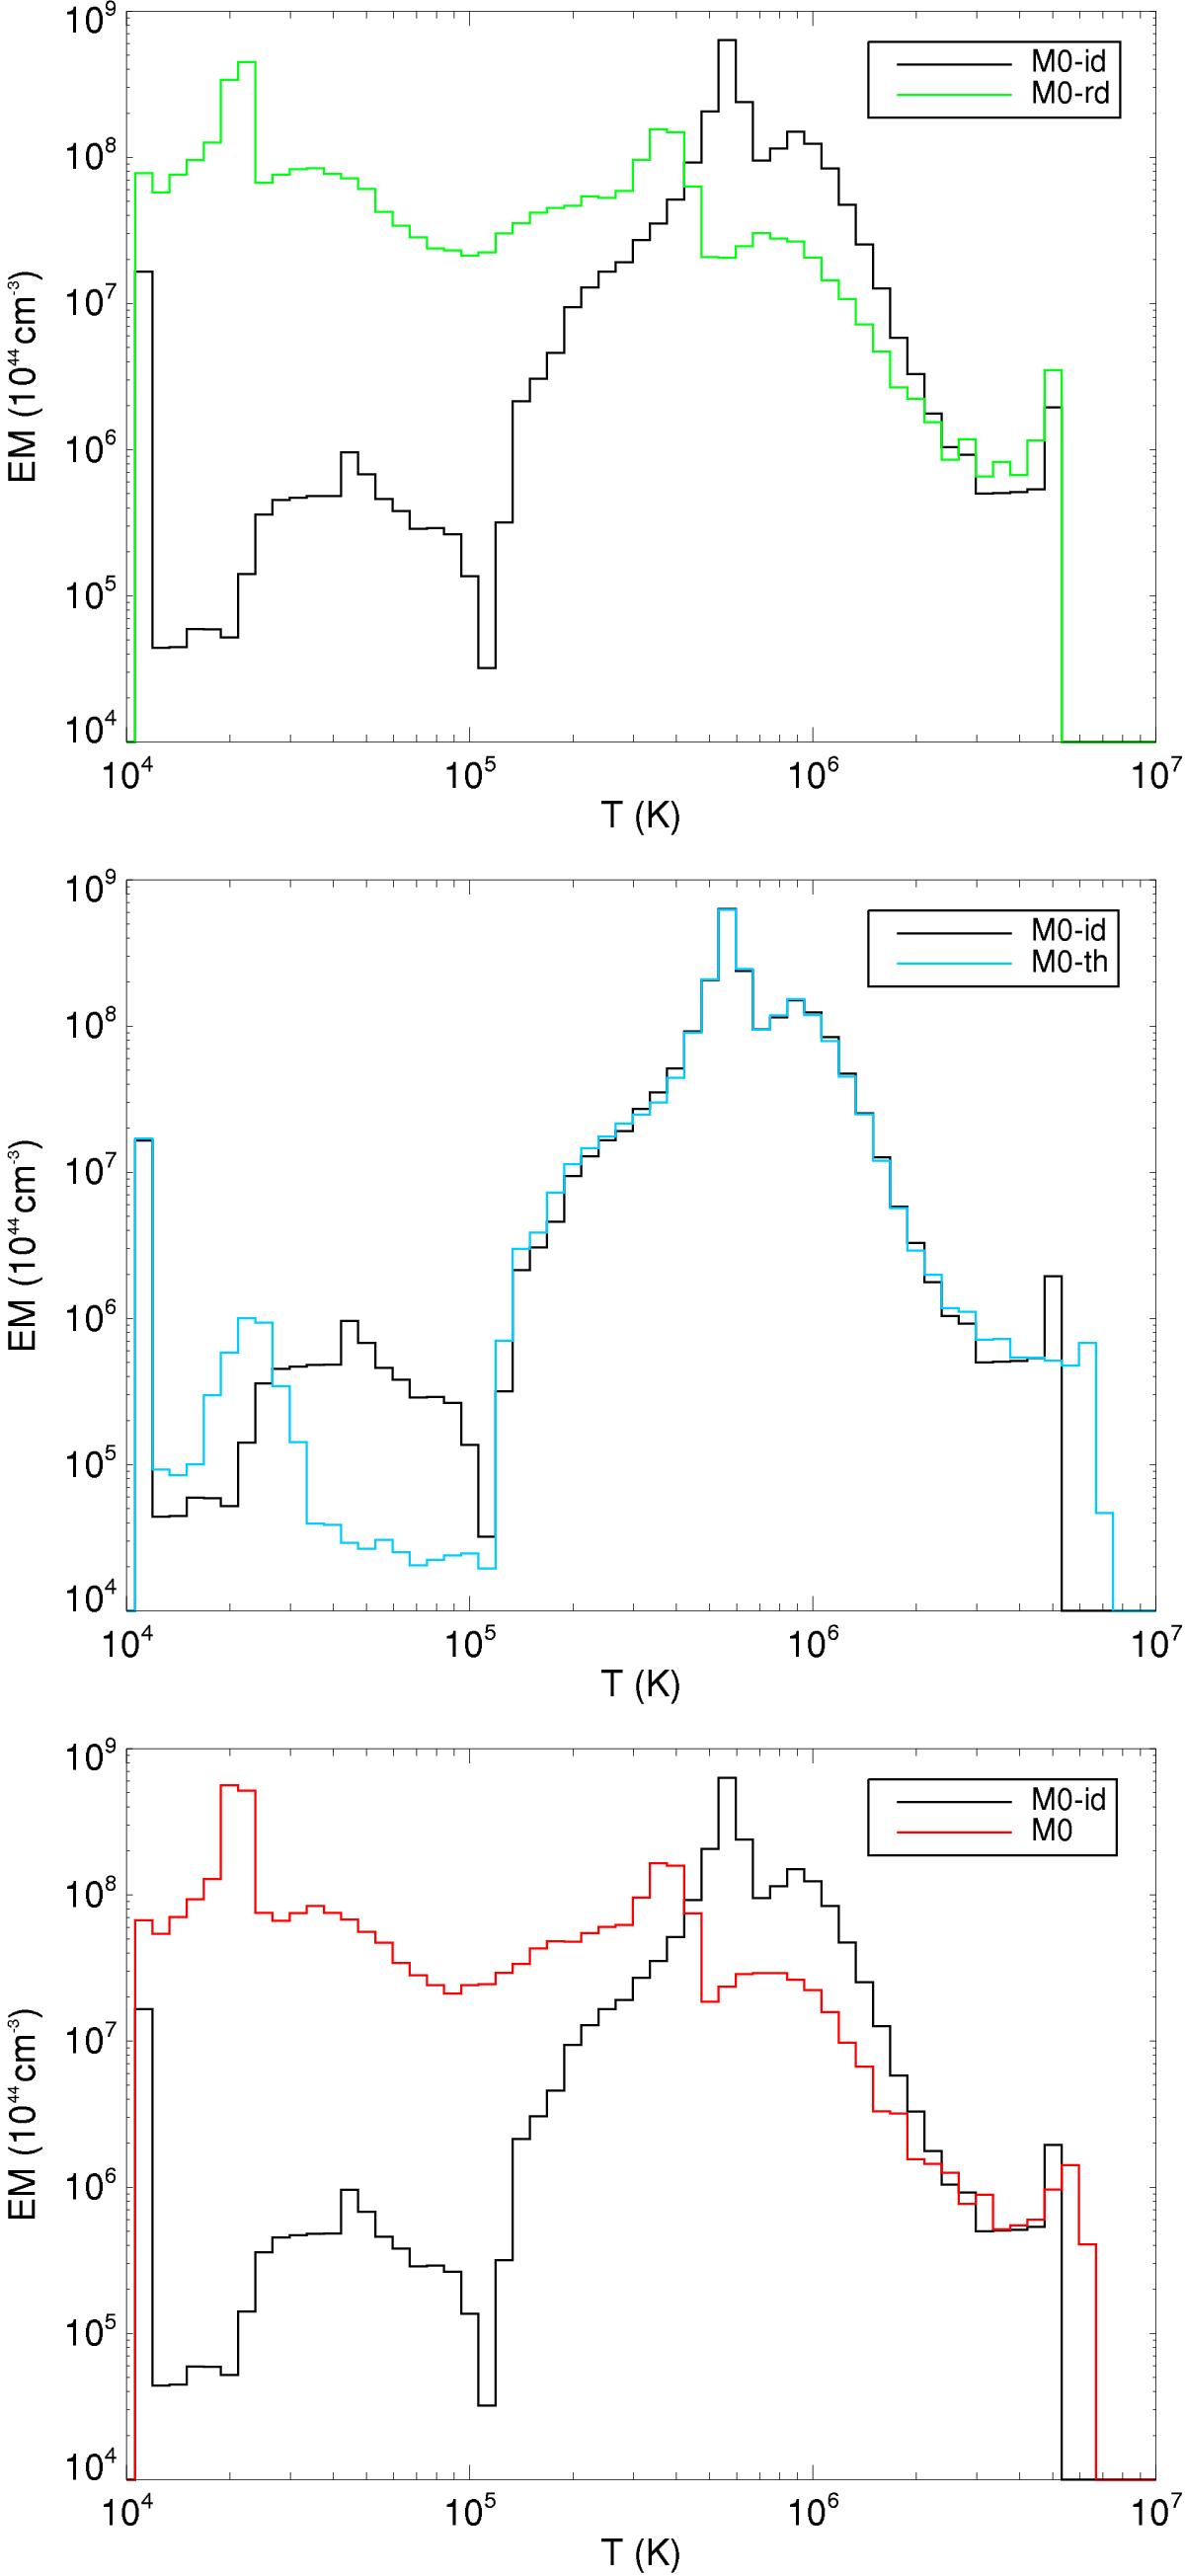
Distribution of emission measure, EM, as a function of the temperature, T, after ≈50 yr of evolution. Different models are compared: M0-rd in green (upper panel), M0-th in blue (middle panel), and M0 in red (lower panel). The EM(T) for the model M0-id is represented by a black line in all panels.
This figure is made of several images, please see below:
Current usage metrics show cumulative count of Article Views (full-text article views including HTML views, PDF and ePub downloads, according to the available data) and Abstracts Views on Vision4Press platform.
Data correspond to usage on the plateform after 2015. The current usage metrics is available 48-96 hours after online publication and is updated daily on week days.
Initial download of the metrics may take a while.