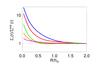
Fig. 7
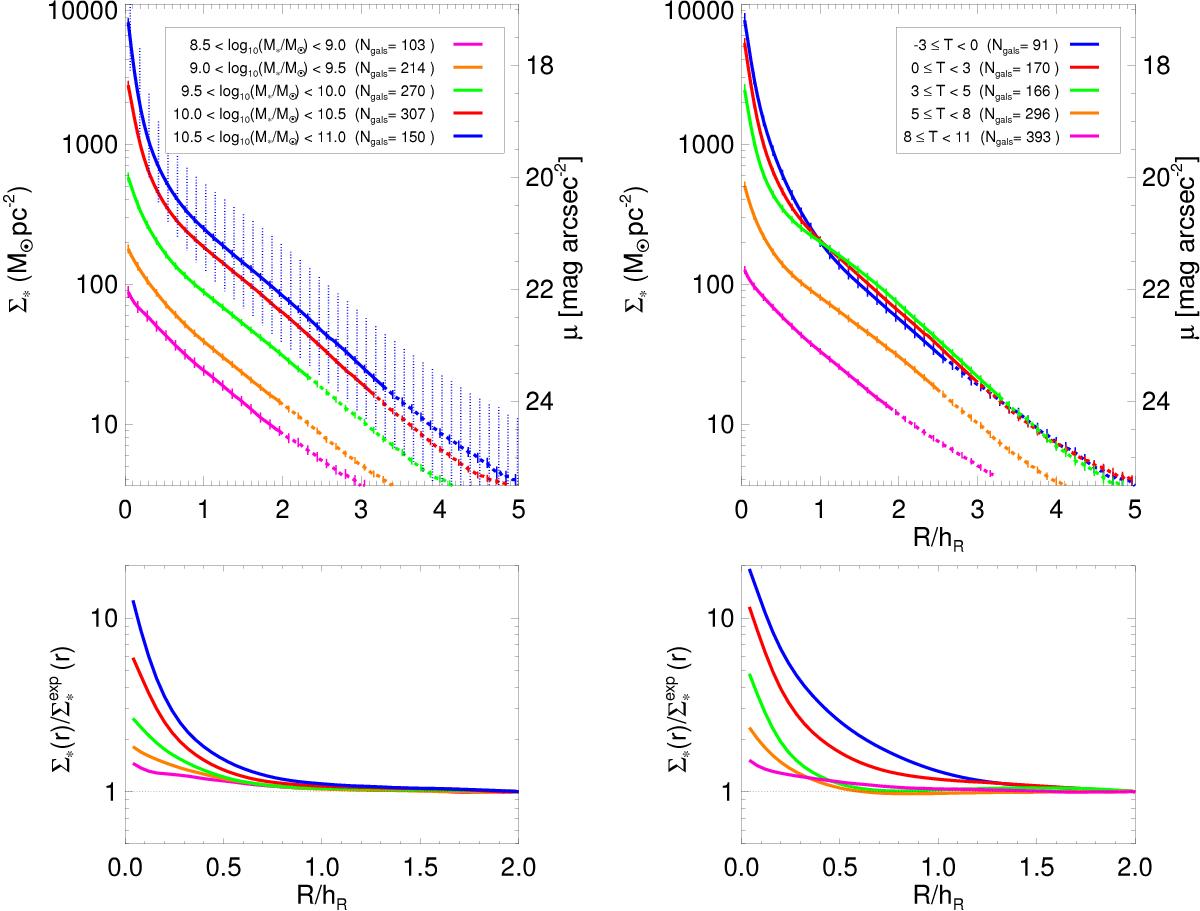
Left column: mean Σ∗ derived by stacking 3.6 μm 1D density profiles (S4G galaxies binned in total stellar mass) resized to the disk scalelength (upper panel), and deviation from an exponential disk (normalized to fit Σ∗ at 2·hR) of the mean Σ∗ within the central regions (r ≤ 2hR) (lower panel). Right column: as in the left column, but taking subsamples in terms of the revised Hubble type of the galaxies. For the upper panels, the different line styles indicate the 75% and 100% sample completeness level in the same fashion as in Fig. 5, and the vertical lines correspond to the standard error of the mean. In the upper left panel, for the bin with largest M∗, we indicate the sample dispersion with vertical dotted lines.
Current usage metrics show cumulative count of Article Views (full-text article views including HTML views, PDF and ePub downloads, according to the available data) and Abstracts Views on Vision4Press platform.
Data correspond to usage on the plateform after 2015. The current usage metrics is available 48-96 hours after online publication and is updated daily on week days.
Initial download of the metrics may take a while.