Fig. 5
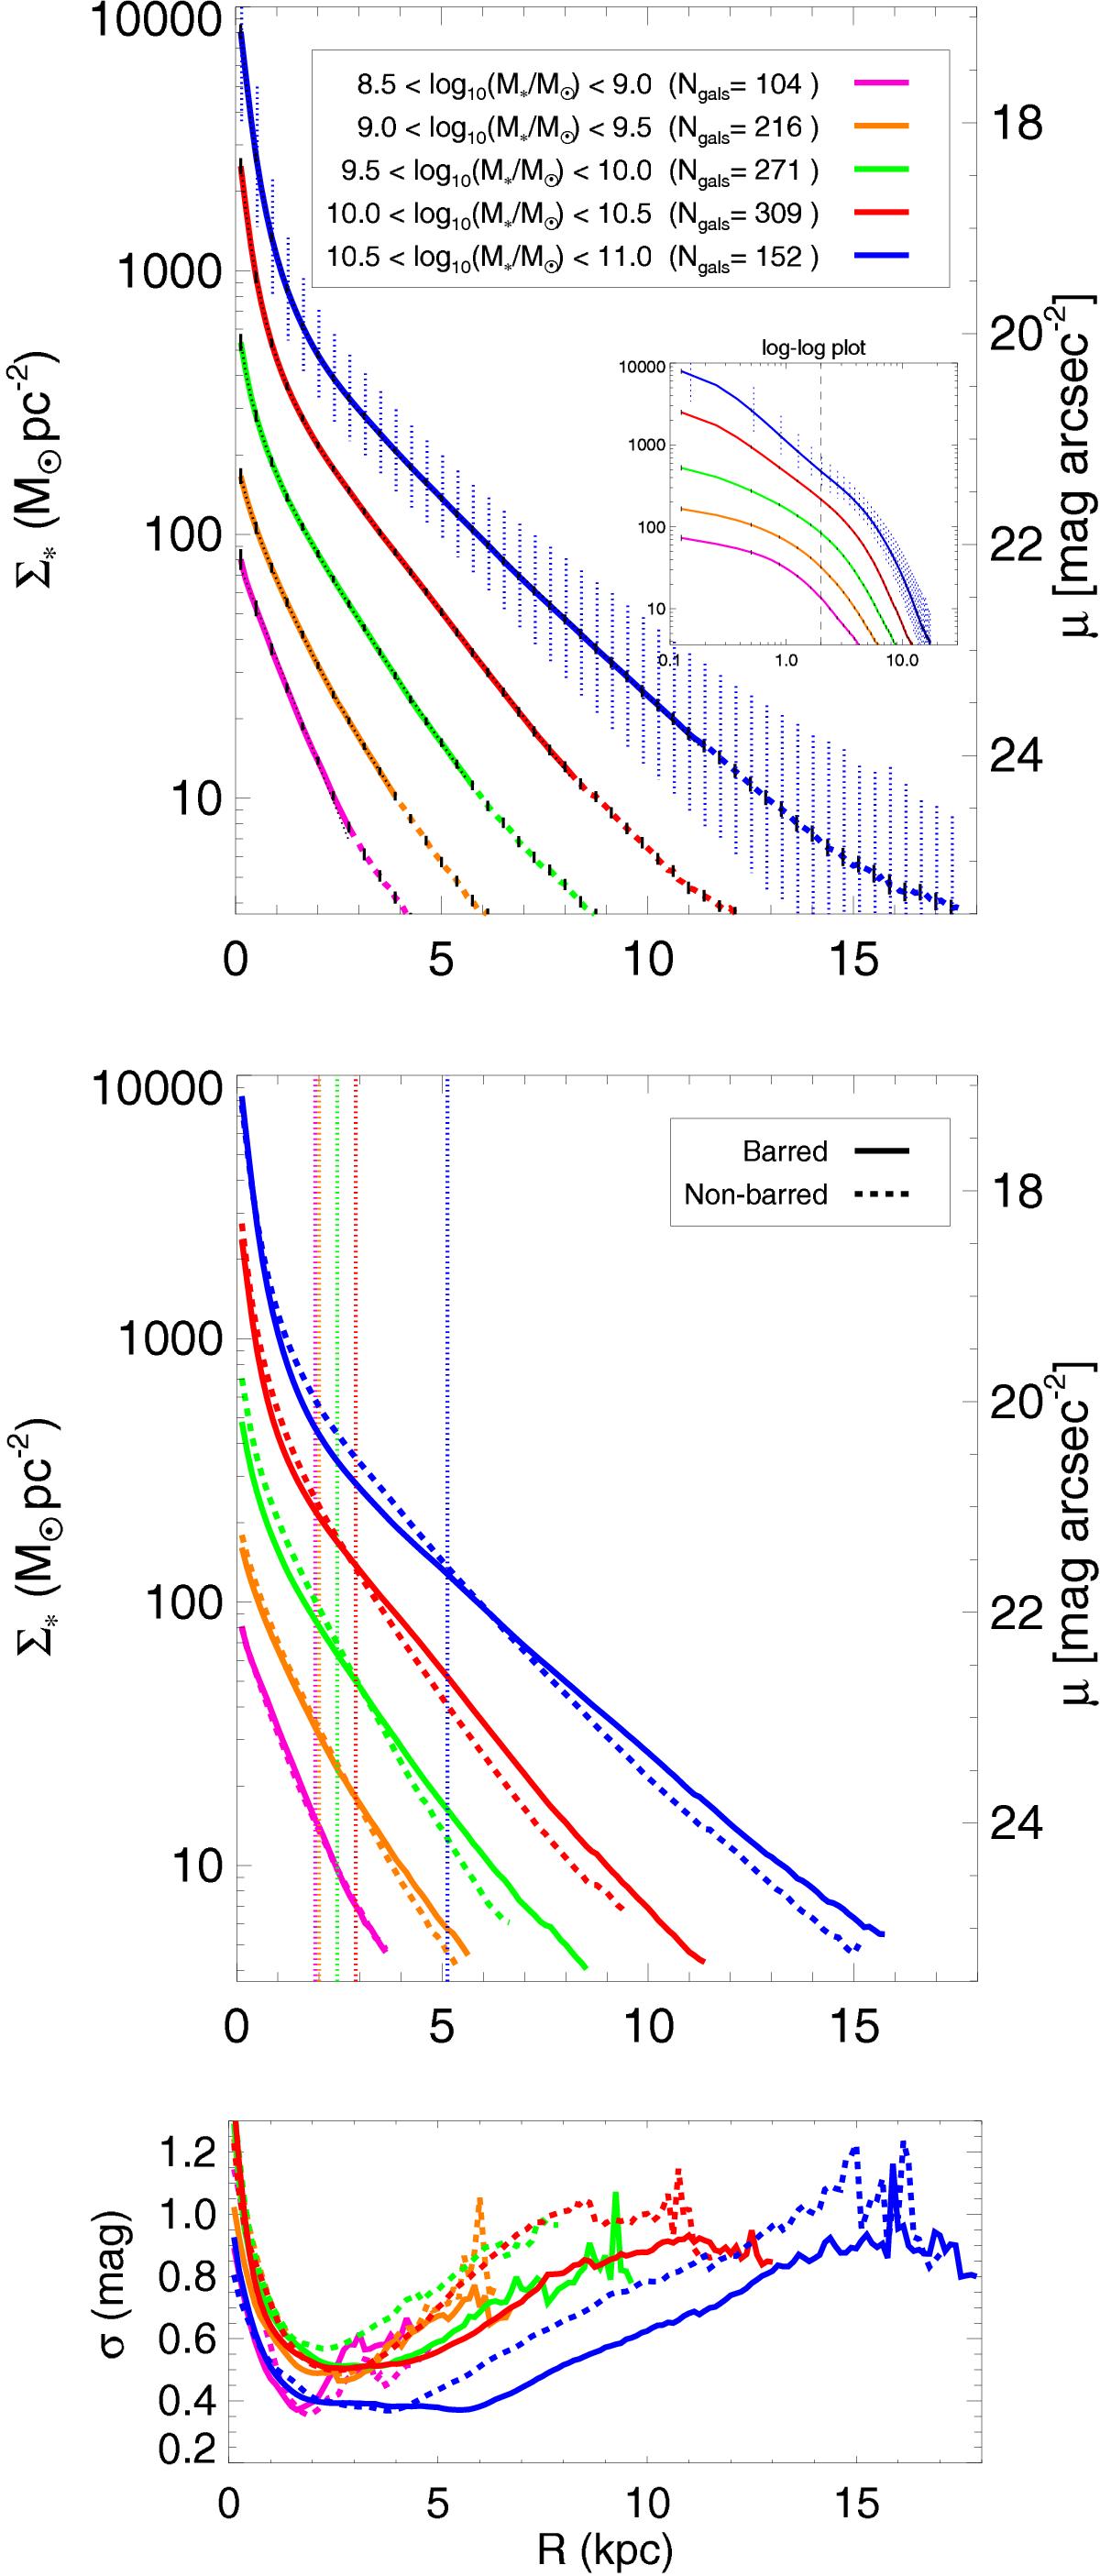
Upper panel: average stellar mass density profiles obtained by binning the sample in total stellar mass, rescaling the 3.6 μm I0 profiles in physical units and stacking them (the inset shows the same in a log-log scale, the R = 2 kpc distance highlighted with a dashed line). The solid lines trace Σ∗ within the radial range with a 100% sample coverage. The dashed lines show Σ∗ when the sample coverage is let to be greater than 75%. The dotted black lines correspond to the two-component Sérsic+exponential fit to the mean disks in the range with a 100% sample completeness level (see the text). The resulting disk parameters are listed in Table 1. The small vertical lines along the profiles indicate the standard deviation of the mean (σ/![]() ). For the bin with the largest M∗, the vertical dotted lines indicate the sample dispersion (σ). Central panel: as in the upper panel, but separating barred (solid line) and non-barred (dashed line) systems (90% coverage). The vertical dotted lines indicate the mean bar size of the barred galaxies in each of the M∗-bins. Lower panel: statistical dispersion of the rescaled luminosity profiles among the galaxies in each of the M∗-bins used in the upper panel. Barred (solid lines) and non-barred (dashed lines) galaxies are studied separately.
). For the bin with the largest M∗, the vertical dotted lines indicate the sample dispersion (σ). Central panel: as in the upper panel, but separating barred (solid line) and non-barred (dashed line) systems (90% coverage). The vertical dotted lines indicate the mean bar size of the barred galaxies in each of the M∗-bins. Lower panel: statistical dispersion of the rescaled luminosity profiles among the galaxies in each of the M∗-bins used in the upper panel. Barred (solid lines) and non-barred (dashed lines) galaxies are studied separately.
Current usage metrics show cumulative count of Article Views (full-text article views including HTML views, PDF and ePub downloads, according to the available data) and Abstracts Views on Vision4Press platform.
Data correspond to usage on the plateform after 2015. The current usage metrics is available 48-96 hours after online publication and is updated daily on week days.
Initial download of the metrics may take a while.