Fig. 2
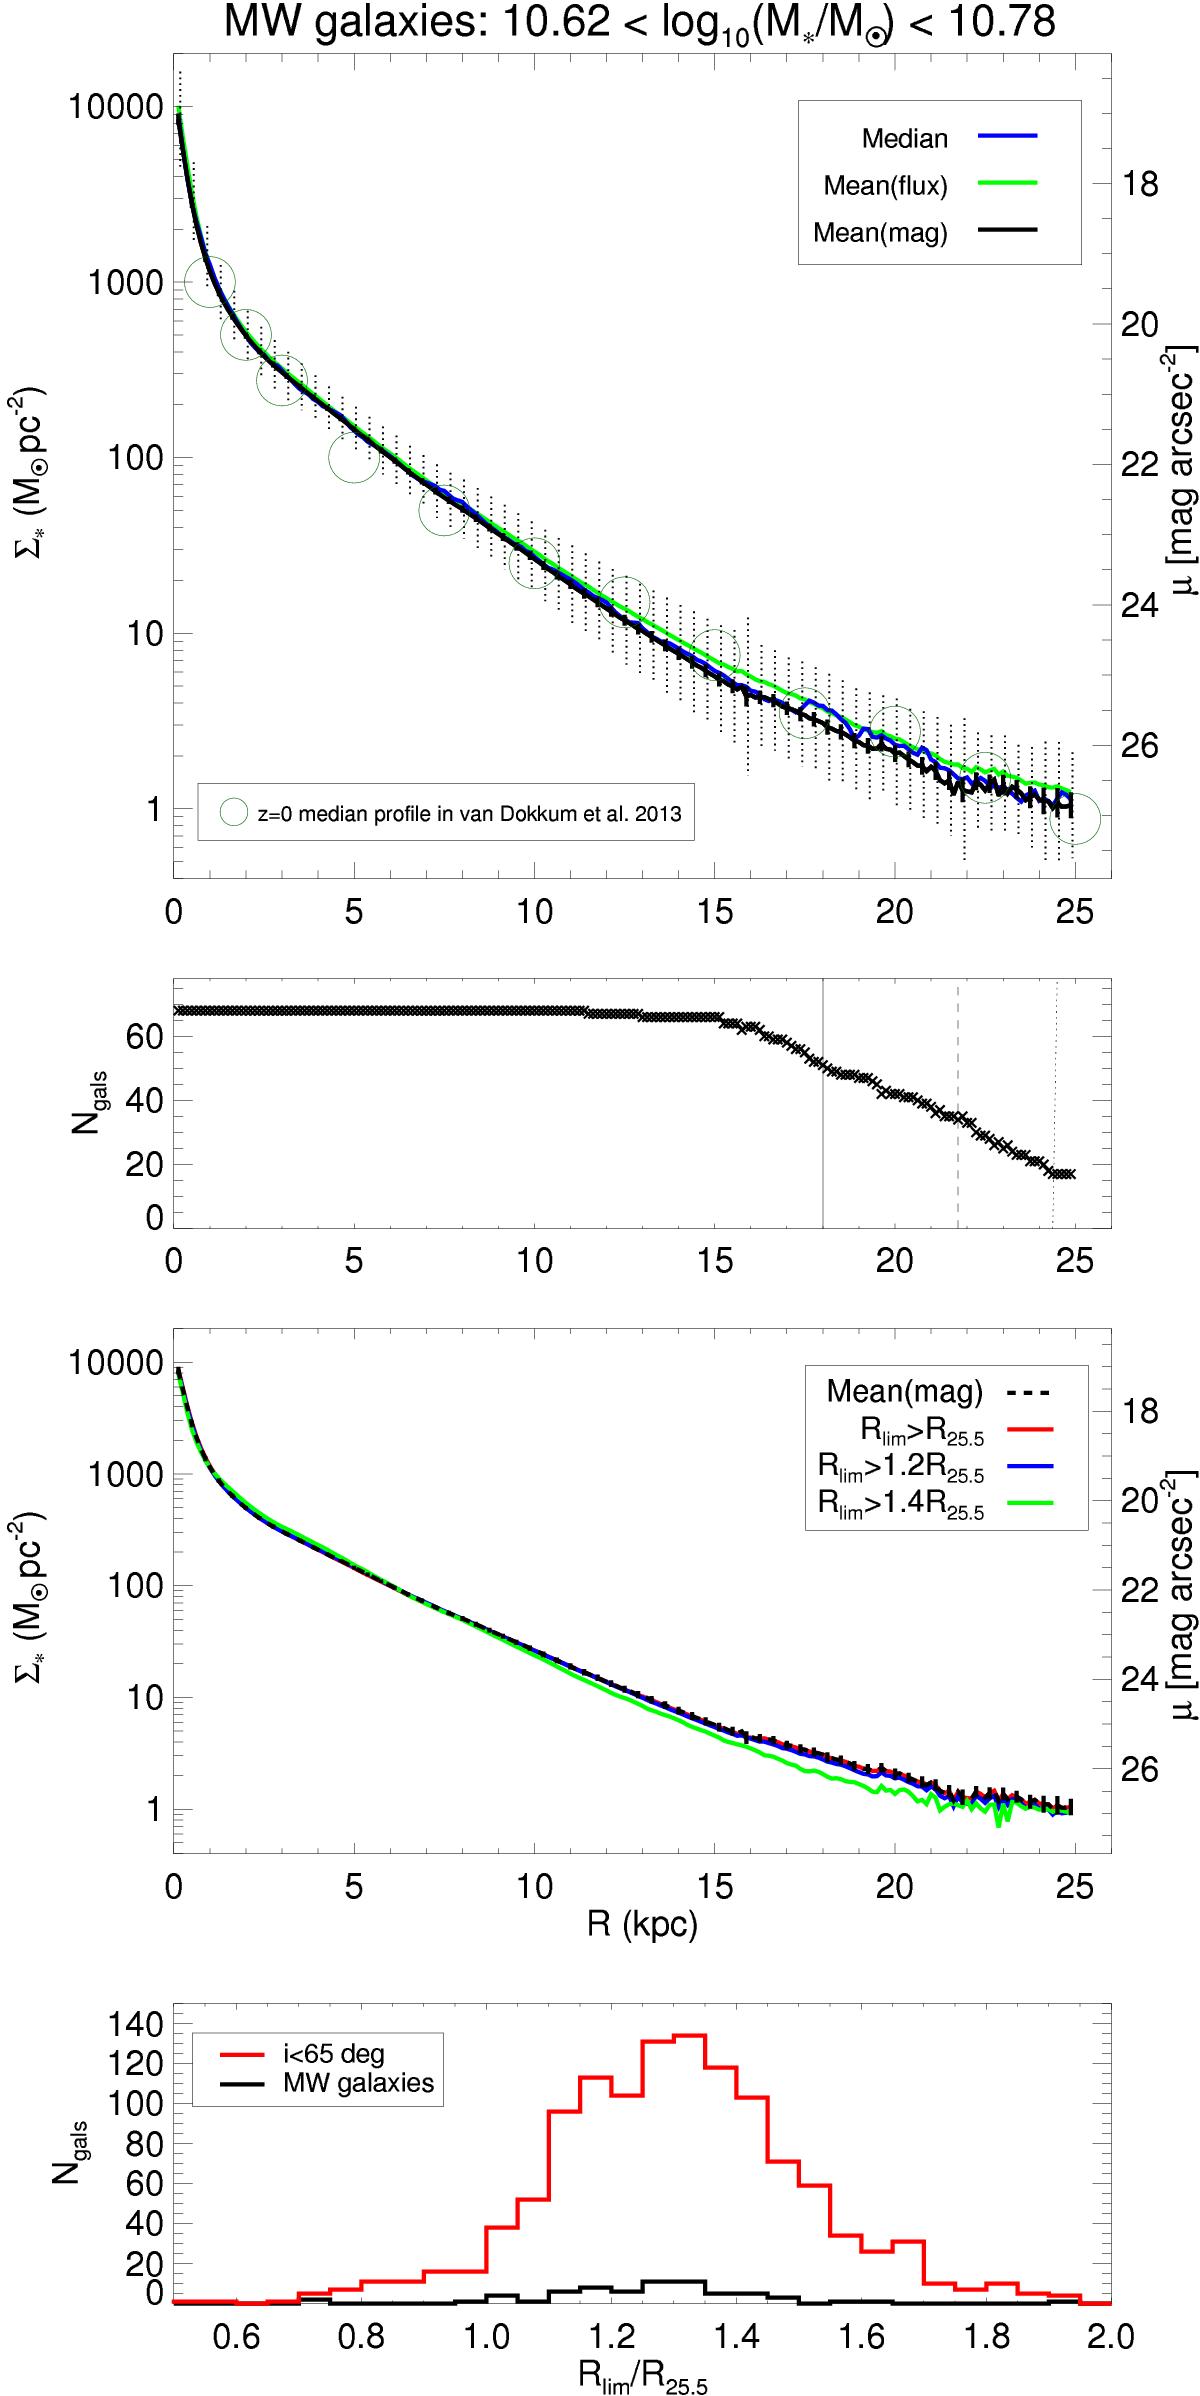
First panel: average surface mass stellar density profiles obtained from the stacking of 3.6 μm I0 profiles, resized to a common physical scale in kpc, of 79 disk galaxies with total stellar masses comparable (± 0.1 dex) to that of the Milky Way (MMW ≈ 5 × 10¹⁰M⊙). Different ways of averaging the stacks are compared, as indicated in the upper right legend. The sample dispersion (σ) and the standard deviation of the mean (σ/![]() ) are indicated with error bars (dashed and solid vertical lines, respectively), centred on the mean profile stacked in units of mag. The median profile for MW galaxies at z ≈ 0 from van Dokkum et al. (2013, traced from their Fig. 3) is also overplotted. Second panel: for the same MW-type stellar mass bin, the fraction of galaxies whose radial profile extends to a given galactocentric radius. The 75%, 50%, and 25% sample completeness levels are highlighted with vertical solid, dashed, and dotted lines, respectively. Third panel: mean Σ∗ of MW galaxies sampled based on how far they extend (estimated from Rlim) relative to R25.5. Fourth panel: for the systems in our sample, histogram of the distributions of the image outer radius relative to R25.5.
) are indicated with error bars (dashed and solid vertical lines, respectively), centred on the mean profile stacked in units of mag. The median profile for MW galaxies at z ≈ 0 from van Dokkum et al. (2013, traced from their Fig. 3) is also overplotted. Second panel: for the same MW-type stellar mass bin, the fraction of galaxies whose radial profile extends to a given galactocentric radius. The 75%, 50%, and 25% sample completeness levels are highlighted with vertical solid, dashed, and dotted lines, respectively. Third panel: mean Σ∗ of MW galaxies sampled based on how far they extend (estimated from Rlim) relative to R25.5. Fourth panel: for the systems in our sample, histogram of the distributions of the image outer radius relative to R25.5.
Current usage metrics show cumulative count of Article Views (full-text article views including HTML views, PDF and ePub downloads, according to the available data) and Abstracts Views on Vision4Press platform.
Data correspond to usage on the plateform after 2015. The current usage metrics is available 48-96 hours after online publication and is updated daily on week days.
Initial download of the metrics may take a while.