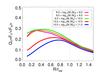
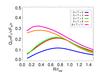
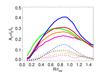
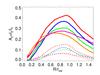
Fig. 18
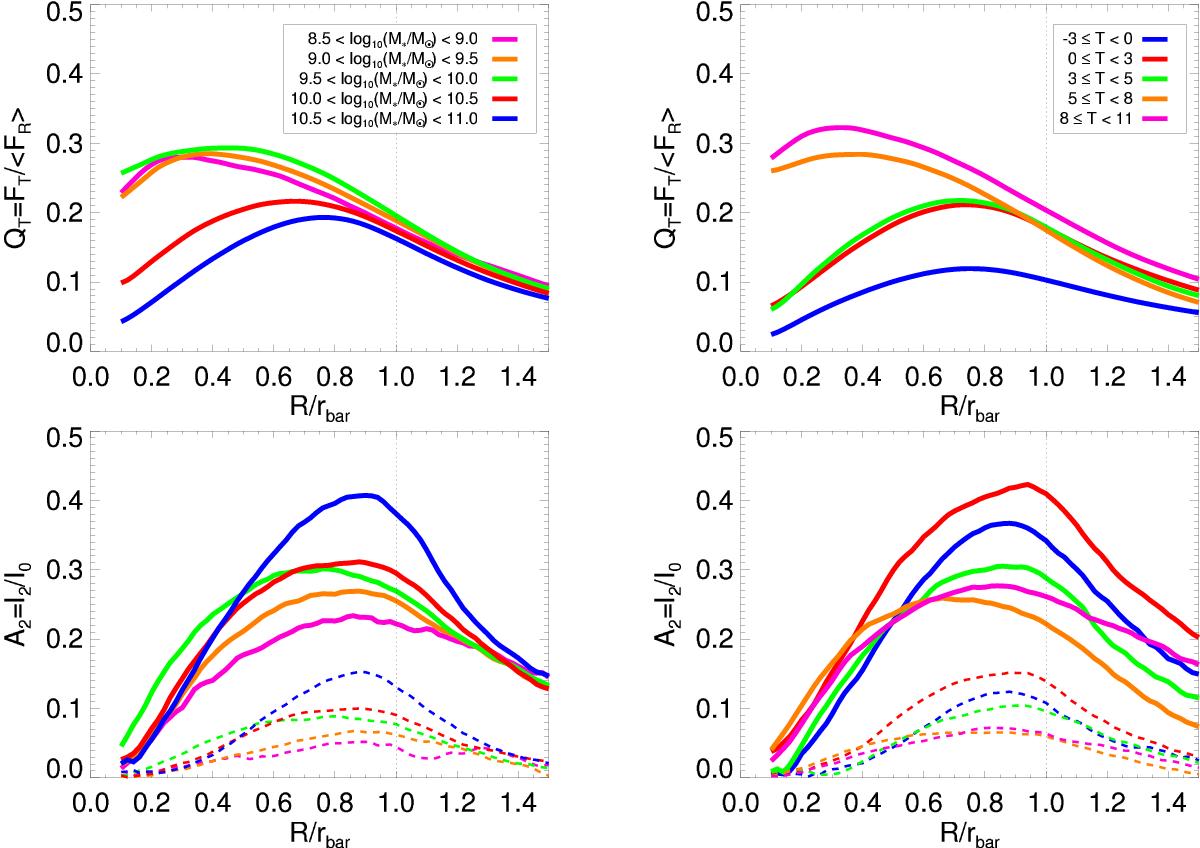
Upper row: tangential-to-radial force profiles associated with the average bars, binning the sample based on the total stellar mass (left) and the Hubble type (right) of the host galaxy. Lower row: m = 2 normalized Fourier amplitude of the average bars (solid lines) using the same sampling as in the upper panels. The dashed lines correspond to the m = 4 normalized Fourier amplitudes. For all panels, the vertical dotted line corresponds to the end of the bar.
Current usage metrics show cumulative count of Article Views (full-text article views including HTML views, PDF and ePub downloads, according to the available data) and Abstracts Views on Vision4Press platform.
Data correspond to usage on the plateform after 2015. The current usage metrics is available 48-96 hours after online publication and is updated daily on week days.
Initial download of the metrics may take a while.