Fig. 11
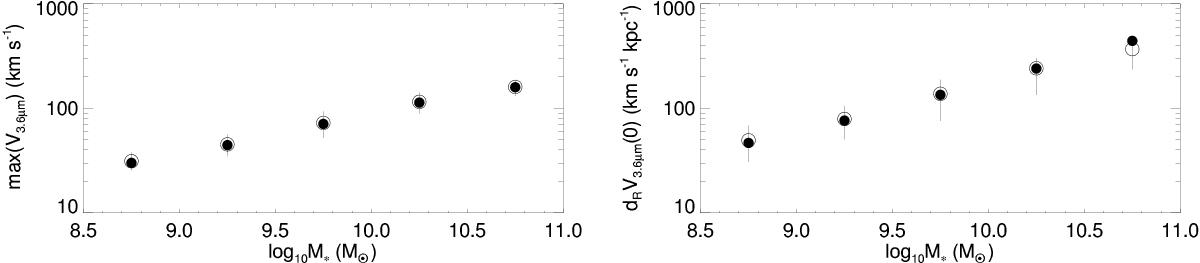
Maximum of the disk component velocity (left panel) and the inner slope (right panel) as a function of the central value of the M∗-bins where the mean surface brightness profiles and the stellar contribution to the circular velocity were inferred. The values resulting from the mean and median V3.6 μm are indicated with open and filled circles, respectively. The vertical lines indicate the change in the maximum rotation velocity and the inner velocity gradient when using ⟨V3.6 μm⟩ ± σ instead of ⟨V3.6 μm⟩.
Current usage metrics show cumulative count of Article Views (full-text article views including HTML views, PDF and ePub downloads, according to the available data) and Abstracts Views on Vision4Press platform.
Data correspond to usage on the plateform after 2015. The current usage metrics is available 48-96 hours after online publication and is updated daily on week days.
Initial download of the metrics may take a while.