Fig. 10
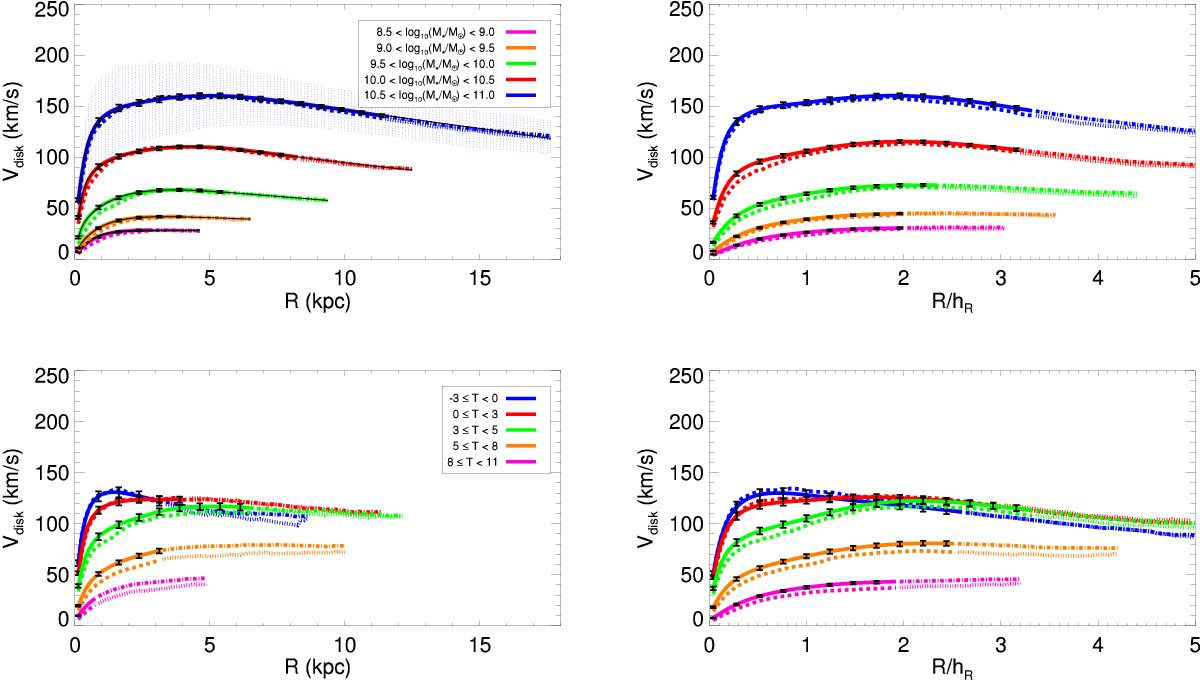
Mean and median stellar contribution to the circular velocities curves (solid and dashed lines, respectively) inferred from the individual radial force profiles resized in physical units (left) and normalized to the disk scalelength (right), with the subsamples defined based on the total stellar mass (upper panels) and revised Hubble type (lower panels). The 100% and 75% sample coverage in the radial direction are indicated with different line styles. For the upper left panel, the black solid lines correspond to the chi-square minimization fit with a double-component Polyex function (see text), with the resulting parameters listed in Table 4. The vertical error bars, centred in the mean profile, indicate the standard deviation of the mean. In the upper left panel, for the bin with largest M∗ we also show the sample dispersion with dotted lines.
Current usage metrics show cumulative count of Article Views (full-text article views including HTML views, PDF and ePub downloads, according to the available data) and Abstracts Views on Vision4Press platform.
Data correspond to usage on the plateform after 2015. The current usage metrics is available 48-96 hours after online publication and is updated daily on week days.
Initial download of the metrics may take a while.