Fig. 2
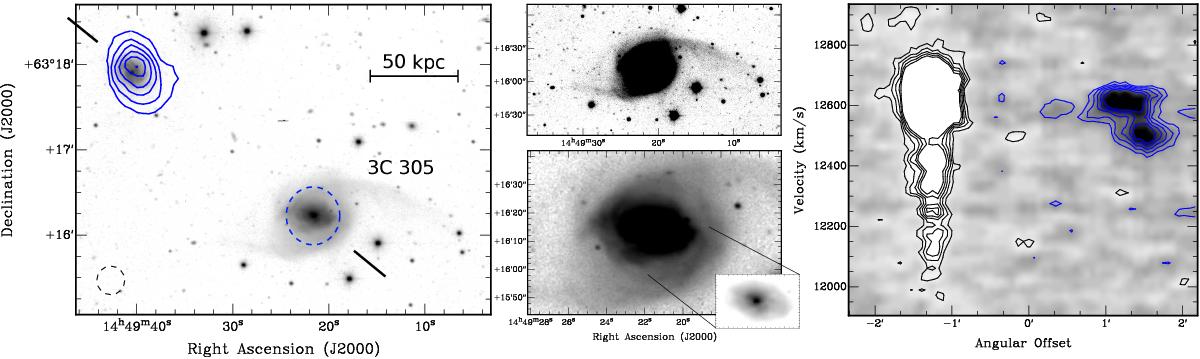
Optical V-band imaging of 3C 305. Left+middle: the various plots show the same image of 3C 305, but with different intensity-scaling and zooming. On the left is shown the larger environment of 3C 305, with overlaid in blue the contours of HI 21 cm emission (levels: 0.03, 0.09, 0.15, 0.21, 0.28, 0.33 Jy bm-1× km s-1). The dashed blue circle shows the region where the H i absorption dominates (see Morganti et al. 2005a). Even though this H i absorption is spatially unresolved, it is strong enough to dominate over any potential H i emission beyond the FWHM of the synthesized beam (dashed black circle on the bottom-left). Right: position-velocity plot of the H i emission (blue contours) and absorption (black contours) along the axis shown in the left plot. Contour levels are at −3, −2, 2, 3, 4, 5, 6 ×σ, with σ = 0.36 mJy beam-1.
Current usage metrics show cumulative count of Article Views (full-text article views including HTML views, PDF and ePub downloads, according to the available data) and Abstracts Views on Vision4Press platform.
Data correspond to usage on the plateform after 2015. The current usage metrics is available 48-96 hours after online publication and is updated daily on week days.
Initial download of the metrics may take a while.