Fig. 1
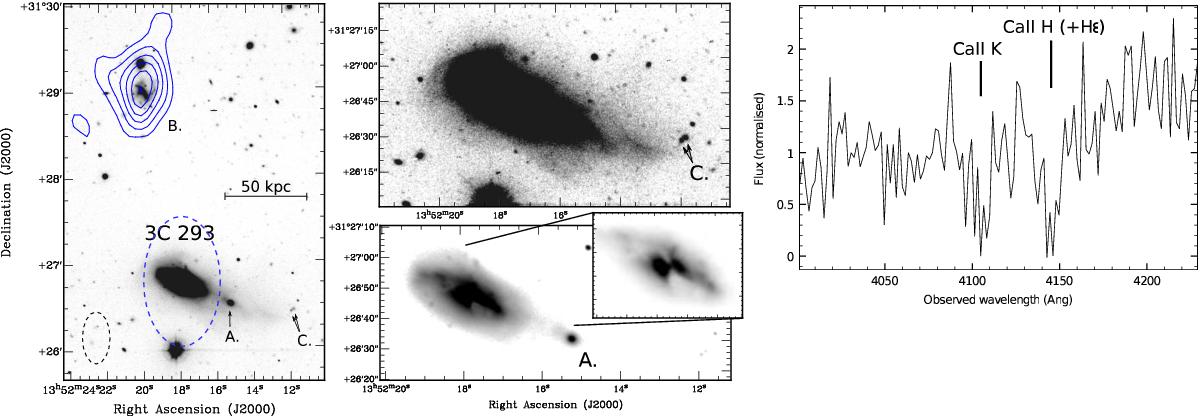
Optical V-band imaging of 3C 293. Left+middle: the various plots show the same image of 3C 293, but with different intensity-scaling and zooming. On the left is shown the larger environment of 3C 293, with overlaid in blue the contours of HI 21 cm emission (levels: 0.04, 0.07, 0.10, 0.13, 0.16, 0.19 Jy bm-1 × km s-1). The dashed blue ellipse represents the region where the H i absorption dominates (see Morganti et al. 2003). Even though this H i absorption is spatially unresolved, it is so strong that it dominates over any potential H i emission far beyond the FWHM of the synthesized beam (dashed black ellipse on the bottom-left). The companion galaxies A and B, and feature C, are described in the text. Right: optical spectrum of source A. The Ca II K and H absorption lines confirm that this source is a companion of 3C 293.
Current usage metrics show cumulative count of Article Views (full-text article views including HTML views, PDF and ePub downloads, according to the available data) and Abstracts Views on Vision4Press platform.
Data correspond to usage on the plateform after 2015. The current usage metrics is available 48-96 hours after online publication and is updated daily on week days.
Initial download of the metrics may take a while.