Fig. A.1
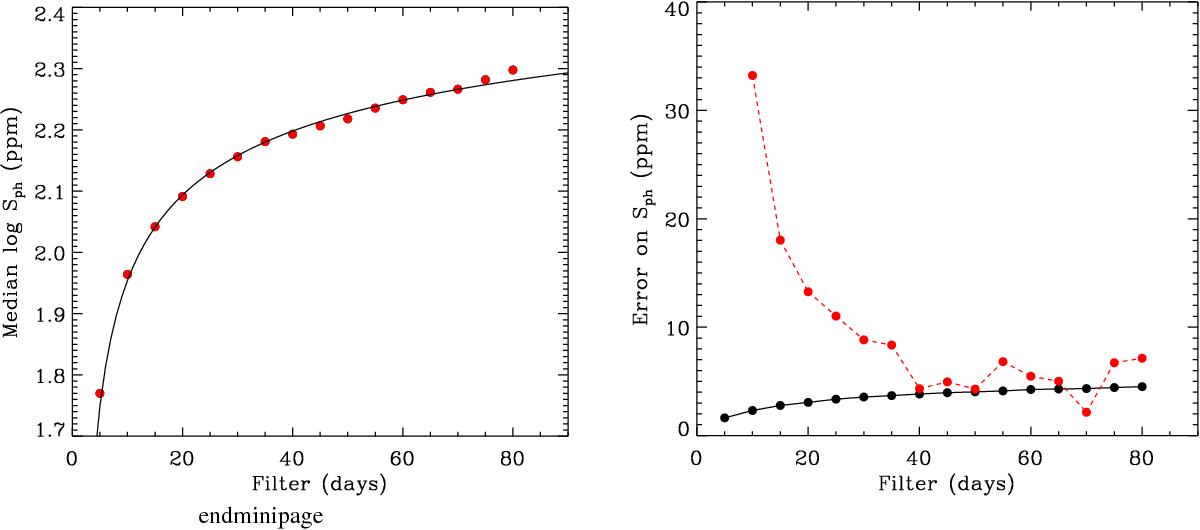
Left panel: median values of the photospheric activity proxy, Sph (in ppm), calculated for the 310 Kepler solar-like stars for which rotation periods were measured (García et al. 2014) as a function of the length in days of the applied filter F (red dots). The solid line corresponds to the associated fit from Eq. (A.1). Right panel: median values of the associated errors (in ppm) of the estimated Sph of the 310 Kepler solar-like stars as a function of the filter Nday (solid line). The red dashed-line corresponds to the difference in Sph between consecutive values of the filter Nday.
Current usage metrics show cumulative count of Article Views (full-text article views including HTML views, PDF and ePub downloads, according to the available data) and Abstracts Views on Vision4Press platform.
Data correspond to usage on the plateform after 2015. The current usage metrics is available 48-96 hours after online publication and is updated daily on week days.
Initial download of the metrics may take a while.