Free Access
Fig. 3
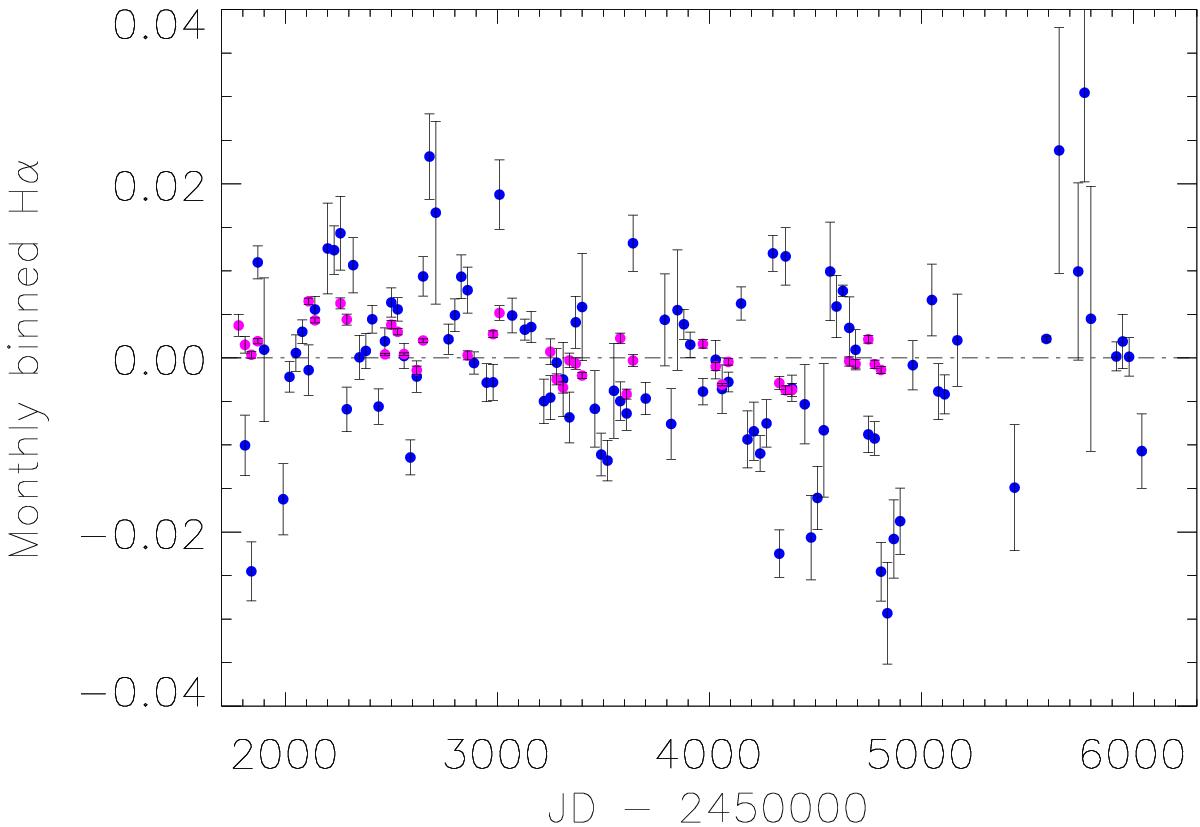
Time evolution of the Hα values of all the spectra normalised to the median value for each star, monthly bins. The red points correspond to the τ Cet data series.
Current usage metrics show cumulative count of Article Views (full-text article views including HTML views, PDF and ePub downloads, according to the available data) and Abstracts Views on Vision4Press platform.
Data correspond to usage on the plateform after 2015. The current usage metrics is available 48-96 hours after online publication and is updated daily on week days.
Initial download of the metrics may take a while.