| Issue |
A&A
Volume 596, December 2016
|
|
|---|---|---|
| Article Number | A29 | |
| Number of page(s) | 7 | |
| Section | Stellar structure and evolution | |
| DOI | https://doi.org/10.1051/0004-6361/201628524 | |
| Published online | 25 November 2016 | |
The rotation-lithium depletion correlation in the β Pictoris association and the LDB age determination
1 INAF–Catania Astrophysical Observatory, via S.Sofia, 78 95123 Catania, Italy
e-mail: This email address is being protected from spambots. You need JavaScript enabled to view it.
2 Universitá di Catania, Dipartimento di Fisica e Astronomia, Sezione Astrofisica, via S. Sofia 78, 95123 Catania, Italy
3 Department of Physics & Astronomy, Uppsala University, Box 516, 751 20 Uppsala, Sweden
4 York Creek Observatory, Georgetown, Tasmania, Australia
5 INAF–Osservatorio Astronomico di Padova, Vicolo dell’Osservatorio 5, 35122 Padova, Italy
6 Instituto de Astronomía y Física del Espacio (IAFE-CONICET), Buenos Aires, Argentina
7 IAU Minor Planet Center code D79, 2 Yandra Street, Vale Park, 5081 South Australia, Australia
8 Observatorio Astronómico de Córdoba, Laprida 854, X5000BGR, Córdoba, Argentina
9 Consejo Nacional de Investigaciones Científicas y Técnicas (CONICET), 1418 Córdoba, Argentina
10 Harlingten Atacama Observatory, San Pedro de Atacama, Chile
11 Aryabhatta Research Institute of Observational Sciences, Manora Peak, 263129 Nainital, India
12 Klein Karoo Observatory, Western Cape, South Africa
Received: 16 March 2016
Accepted: 24 July 2016
Abstract
Context. Evidence exists in the 125-Myr Pleiades cluster, and more recently in the 5-Myr NGC 2264 cluster, to show that rotation plays a key role in lithium (Li) depletion processes among low-mass stars. Fast rotators appear to be less Li-depleted than equal-mass slow rotators.
Aims. We intend to explore the existence of a Li depletion-rotation connection among the β Pictoris members at an age of about 24 Myr, and to use this correlation either to confirm or to improve age estimates based on the lithium depletion boundary (LDB) modeling.
Methods. We photometrically monitored all the known members of the β Pictoris association with at least one lithium equivalent width (Li EW) measurement from the literature.
Results. We measured the rotation periods of 30 members for the first time and retrieved the rotation periods for another 36 members from the literature, building a catalogue of 66 members with a measured rotation period and Li EW.
Conclusions. We find that in the 0.3 < M < 0.8M⊙ range, there is a strong correlation between rotation and Li EW. For higher mass stars, no significant correlation is found. For very low-mass stars in the Li depletion onset, at about 0.1 M⊙, there are too few data to infer a significant correlation. The observed Li EWs are compared with those predicted by the Dartmouth stellar evolutionary models that incorporate the effects of magnetic fields. After decorrelating the Li EW from the rotation period, we find that the hot side of the LDB is well fitted by Li EW values that correspond to an age of 25 ± 3 Myr, which is in good agreement with independent estimates from the literature.
Key words: stars: late-type / stars: rotation / starspots / stars: individual: beta Pictoris association / stars: activity / stars: abundances
© ESO, 2016
1. Introduction
Recently, much attention has been paid to the 24 ± 3 Myr (Bell et al. 2015) young β Pictoris stellar association. Several studies have enabled the number of confirmed members to increase significantly, leading to the discovery of many more candidate members. Recent works include: Lépine & Simon (2009); Kiss et al. (2011); Schlieder et al. (2010, 2012); Shkolnik et al. (2012); Malo et al. (2013, 2014a,b). The first comprehensive search for the rotation periods of the low-mass members of β Pictoris was carried out by Messina et al. (2010, 2011) who retrieved a total of 38 low-mass members (i.e., spectral types from late F to M) from the earlier compilations of Zuckerman & Song (2004), Torres et al. (2006), and Kiss et al. (2011). Their study provided the rotation periods of 33 out of 38 members.
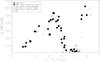 |
Fig. 1 Distribution of Li EW versus V−Ks color for 66 members of the β Pictoris association. The meaning of symbols is given in the legend. Dotted vertical lines indicate the range of values for stars with multiple Li EW measurements. All circled symbols indicate stars hosting debris discs. |
In the light of these studies, we also explored the most recent literature and, as a result, we finally compiled a new list of 117 stars among members and candidate members with spectral types later than about F3V. Based on this, we started a new rotational study on this enlarged sample. To get the photometric rotation periods of our targets, we used our own observations, archive data, and also made use of periods from the literature.
As result of our photometric investigation, we obtained the rotation periods of 112 out of 117 stars. Specifically, for the first time we measured the rotation periods of 51 stars. For 28 other stars, with our analysis we were able to confirm the values of new or archived data reported in the literature. For 33 stars we adopted the literature values. For the remaining five stars, our periodogram analysis did not provide the rotation period. The results of this investigation are presented in the catalogue of photometric rotation periods of the β Pictoris association members (Messina et al. 2016, Paper I) where we describe the photometric observations that were newly obtained, their reduction and analysis, and a detailed discussion of our results obtained for each individual star.
In this paper (Paper II), we focus on a sub-sample consisting of 66 members for which we know the rotation period and have at least one measurement (from the literature) of the lithium equivalent width (EW). To date, this sub-sample is the largest of any known young loose association. We use it to investigate the correlation between rotation and Li depletion and to compare with earlier results the age of the β Pictoris association obtained by the modeling of the lithium depletion boundary (LDB), after decorrelating the Li EW from rotation.
2. Sample description
The sample under analysis consists of 66 members, with a spectral type later than F3V with one measurement, at least, of the Li EW (see Table A.1). This sample, which has significantly increased with respect to earlier studies, makes a new investigation on the age of the β Pictoris association necessary with the LDB modeling method. In fact, earlier studies made use of a smaller number of association members. Mentuch et al. (2008) made use of a sample of 23 members; Macdonald & Mullan (2010) used a sample of only 10 members. Binks & Jeffries (2014) and Malo et al. (2014b) used about 40 and 34 members, respectively.
As a result, we now know the rotation periods of all 66 stars, which enables us to get more accurate results and to explore the mechanism of Li depletion deeply. More specifically, for the first time we measured the rotation periods of 30 out of 66 members. These new measurements are presented in the mentioned catalogue containing the photometric rotation periods of all 112 members/candidate members of the association. For another 16 members, the rotation periods were taken from Messina et al. (2010, 2011). The remaining 20 rotation periods were taken from different literature sources.
To date, this sample represents one of the three largest samples ever used to investigate the correlation between rotation period and Li depletion. The other samples consist of members of the Pleiades and of the M34 stellar open clusters investigated by Gondoin (2014) using the rotation periods from Hartman et al. (2010), and of members of the NGC 2264 open cluster whose results on the lithium-rotation connection are presented by Bouvier et al. (2016). The earlier larger sample of Pleiades members analysed by Soderblom et al. (1993) made use of the projected rotational velocity (vsini), which is less accurate owing to the uncertainty arising from the unknown sini.
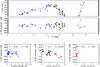 |
Fig. 2 Top panel: distribution of Li EW versus V−Ks color in three color ranges: 0.5 < V−Ks < 3.4 mag (19 stars), 3.4 < V−Ks < 4.5 mag (21 stars), and 5.4 < V−Ks < 5.9 mag (6 stars) of β Pictoris members with known rotation period and with overplotted (solid lines) the linear fits. Middle panel: residuals from the fit with horizontal dotted lines indicating the amplitude of dispersion. Bottom panels: distribution of Li EW residuals versus rotation period in the three color ranges. Solid lines are linear fits, r is the Pearson linear correlation coefficient and α the significance level. |
3. Li distribution
In Fig. 1, we plot the distribution of Li EW for all 66 members versus the V−Ks color. This color index is measured using the Ks magnitude from the 2MASS project (Cutri et al. 2003) and the brightest (presumably unspotted) V magnitude from the long photometric time series available in the All Sky Automated Survey (ASAS) archive (Pojmanski 2002). This choice enables us to reduce the impact of photometric variability on the V-band magnitude. Among different color indexes, the V−Ks turned out to be the most homogeneous and with the largest range of values, enabling an accurate representation of different masses. We applied no color correction for interstellar absorption since the members under study have distances in the range from 10 pc to 80 pc, therefore the interstellar reddening can be considered negligible. The average uncertainty on this color is σV−Ks = 0.03 mag. There are only eight stars that belong to close binaries that are not resolved either in V or in Ks magnitudes and consist of components that differ by no more than two spectral sub-classes. For these stars the measured V−Ks for the primary component, the one with measurement of Li EW, resulted in being redder than the expected value for the spectral type. In these cases we adopted the V−Ks values from Pecaut & Mamajek (2013), which corresponded to the spectral type of the primary component. The Li EW measurements are retrieved from Mentuch et al. (2008), da Silva et al. (2009), Kiss et al. (2011), Binks & Jeffries (2014), Moór et al. (2013), Malo et al. (2014b), Reid et al. (2002), Torres et al. (2006), and Desidera et al. (2015). The average uncertainty associated with these measurements is generally not larger than ~40 mÅ. The error bars associated with the measurements (in both axes) are equal to the size of the symbols plotted in Fig. 1. In a few cases more than one measurement is available. The range of values of the Li EW in these cases is plotted with a dotted line. Almost all measurements (for a total of 20 members) in the color range 4.5 <V−Ks< 5.3 mag are upper limits. Different symbols are used to distinguish the different nature of the considered members (see the legend in Fig. 1). Detailed information for each member is given in Paper I and the criterion to distinguish close from wide components is given in Messina et al. (Paper III, in prep.).
In Fig. 1, we note three important features. First, we note a very well defined LDB that will be used for an estimate of the age. Second, in the color range 3.2 <V−Ks < 4.5 mag, we note, even by just a visual inspection, a scatter in the Li EW that is significantly larger than in the range of bluer members. We investigate the role played by the rotation in producing this scattered depletion. Finally, we note that in the range 2.5 < V−Ks < 3.0 mag, we only have three stars that all have Li EWs significantly lower than the average. This color range corresponds to K2–K3 spectral types and is reminiscent of the Li dip observed in more evolved main-sequence stars (see, e.g., Balachandran 1995). One of these stars is HIP 84586, a SB2 spectroscopic binary whose tidal locking between the two components may have altered the internal mixing and, consequently, enhanced the Li depletion rate with respect to single stars. The two other stars are TYC 6878 0195 1 and HIP 11437A, both components of wide binaries that are expected to have evolved, rotationally, as single stars. We only note that HIP 11437A hosts a debris disc.
4. The rotation-Li depletion correlation
We first analyse the possible correlation between rotation and Li EW to investigate what role the rotation plays in producing the observed Li EW dispersion among stars with similar masses. This information will be used for a more accurate modeling of the LBD to infer the association age.
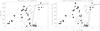 |
Fig. 3 Left panel: distribution of Li EWs versus V−Ks color for β Pic members. Solid lines represent the Li EWs predicted by the models of Baraffe et al. (2015) for ages in the range from 5 to 25 Myr. Right panel: same as in the left panel, but with models arbitrarily shifted by 0.7 mag towards redder colors to match the observations. |
We analyse the following three sub-groups separately: blue stars with 0.5 ≤ V−Ks < 3.4 mag totaling 19 members, red stars with 3.4 ≤ V−Ks ≤ 4.5 mag totaling 21 members, and very red stars with 5.4 < V−Ks< 5.9 mag totaling 6 members that correspond to the onset of the Li depletion. Stars with V−Ks > 5.9 mag have not undergone any Li depletion. In the blue stars sample, we observe a trend of increasing Li EW with increasing color (decreasing mass); in the red stars sample, we observe the opposite trend; in the very red star sample, we again observe a trend of increasing Li EW with increasing color. As shown in the top panel of Fig. 2, linear fits are enough for our purposes, i.e., approximating the mass dependence to outline the correlation with the rotation period. In the middle panel, we plot the residuals with respect to the linear fits. Only one star (HIP 11437A), represented by a square and significantly deviating from the trend, was excluded from the fit. Positive residuals indicate stars that are more Li rich than the average, whereas negative residuals indicate stars that are more Li-depleted than the average. In the case of blue stars, we find a peak-to-peak amplitude of the dispersion σ = 90 mÅ of the residuals from the fit, whereas in the case of red stars the peak-to-peak amplitude of the dispersion is about twice as large, σ = 180 mÅ. Finally, in the case of very red stars, we find σ = 125 mÅ. The dotted lines represent peak-to-peak amplitudes of dispersions in the three color ranges. Now, to probe any dependence of the residual dispersion on the rotation period, we computed the Pearson linear correlation coefficients (r) and significance levels1 (α) between the residuals and the rotation period, as well as the Spearman’s rank correlation (Spearman 1904). In the case of blue stars we find r = −0.19 with a significance level α < 50%, i.e., no dependence exists of the residuals on rotation (from Spearman’s rank correlation we found ρ = −0.04 with very small significance p-value = 0.77). On the contrary, for red stars we found r = −0.71 with very high significance level α > 99.9% (similarly, from rank correlation we found ρ = −0.56 with high significance p-value = 0.01). Finally, for very red stars, we find r = + 0.13 with a significance level α ~ 80% (from Spearman’s rank correlation we found ρ = 0.29 with very small significance p-value = 0.58). Consequently, in this regime of very red stars, where we do not have enough data, we cannot asses the existence or not of a rotation-Li depletion connection.
In the case of red stars (3.2 ≤ V−Ks ≤ 4.5 mag) we can state that the Li depletion is significantly correlated to rotation that seems to maintain fast rotators less depleted than slow rotators according to Eq. (1):  (1)where the Li EW is in mÅ and the rotation period P in days. The average uncertainty on the rotation period (ΔP = 0.7%) is negligible with respect to that of the Li EW. After decorrelating the Li EW from the rotation of red stars, the dispersion turns out to be reduced by about a factor of 2, σ = 50 mÅ and becomes comparable with that measured among blue stars, where no dependence on rotation was observed, and among very red stars. This residual dispersion is larger than the uncertainty associated with the Li EW measurements. Therefore, apart from mass and rotation, other causes must play a role in producing the observed dispersion. The intrinsic variability of the Li EW is certainly one cause. In fact, we know that spotted stars, as are all our targets, exhibit a rotational modulation of the Li EW. Specifically, the EW is larger at the rotation phases when the spots are most clearly in view, and, consequently, the average surface temperature is lower. In our sample, 26 stars have two EW measurements. We find that the average difference between these multiple measurements is ⟨ ΔEW ⟩ = 26 mÅ. We note only two extreme cases: TX Psa and 2MASS J05082729-2101444, both very red stars with ΔEW > 100 mÅ.
Generally, the rotational Li variability in young stars is not larger than about 5% (see Appendix in Bouvier et al. 2016). In our case, this corresponds to a range from ~5 to 25 mÅ in absolute values, which is of the same order of the intrinsic variability we found.
4.1. Observed versus predicted LBD
It is interesting to make a comparison between the measured distribution of Li EWs and the predictions of evolutionary models. In the following, we first consider the evolutionary models of Baraffe et al. (2015) for solar abundances. Solar abundances have been measured in a few members, like β Pic and PZ Tel, and generally they were adopted for the whole association (see, e.g., Mentuch et al. 2008). The surface Li abundance is first derived from the ratio of surface Li abundance to initial abundance provided with the models, using an initial abundance of Li0 = 1 × 10⁻⁹. Then, to make the comparison with the observations, we transformed the model Li abundance into Li EW. For this purpose, we used the curves of growth from Zapatero Osorio et al. (2002). These are valid in the effective temperature range 2600 < Teff < 4100 K and for 1.0 < A(Li) < 3.4.
In the left panel of Fig. 3, we plot the measured Li EW and compare this distribution with the Li EW derived from Baraffe et al. (2015) models. We note a strong mismatch between observations and model predictions. For ages in the 10–25 Myr range, the models predict a substantial/complete depletion in the V−Ks color range 3.8–4.5 mag, whereas the Li gap is observed at colors that are redder by about 0.7 mag. In fact, a better match is achieved if we arbitrarily shift the model colors by Δ(V−Ks) = +0.7 mag (see right panel of Fig. 3). Moreover, assuming that the fast rotators have rotation-unaffected Li abundances, we maintained their observed Li EW, whereas for the slower rotators we have increased the Li EW according to Eq. (1). As shown in the right panel of Fig. 3, we find that, even applying this V−Ks color shift and the rotation decorrelation, we can infer different ages by looking at different parts of the observed Li depletion since the slope of the observed depletion is different to that predicted by the models.
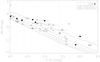 |
Fig. 4 Absolute magnitude versus V−Ks color of members in the Li gap. Solid lines represent the isochrones corresponding to ages from 5 (top) to 25 Myr (bottom). |
We note that the same mismatch between observations and models is found when different colors (e.g., V−I, J−H, or J−K) or the effective temperatures are used to make the comparison. The colors of the stars in the Li depletion gap 4.4 <V−Ks < 5.4 mag have been accurately checked. For a few stars (either single or resolved components in wide binaries) the V−Ks is measured for each component. For other stars (components of unresolved binaries) the V−Ks is derived from the spectral type of the primary component, which is the one with measured Li. In the first case, the error on V−Ks is ±0.03 mag, in the latter case is ±0.15 mag. In Fig. 4 we compare the absolute magnitudes of the members in the Li gap with isochrones for ages from 5 to 25 Myr taken from Baraffe et al. (2015). We note that within the gap (4.4 < V−Ks < 5.4 mag) the stars seem to be either more luminous or redder than expected for the most recent age estimation of 24 Myr by Bell et al. (2015). A better agreement is observed at bluer colors, where stars are within the 10–25 Myr isochrones. If we correct the magnitudes of close components for binarity, we get a better agreement, but do not solve the overluminosity. This indicates that, in order to reproduce the data, the predicted Baraffe et al. (2015) colours should be shifted redward.
All stars in the gap have a prominent magnetic activity as is inferred from photometric variability, X-ray emission, and near-UV/far-UV excess. Therefore, models including the effect of magnetic fields should be more adequate for describing the Li depletion pattern. For this reason, we also made use of the Dartmouth stellar evolutionary models that incorporate the effects of magnetic fields (Feiden 2016; Mann et al. 2016). In these models, inhibition of convection by magnetic fields cools the stellar surface temperature, thereby slowing the contraction rate of young stars. Stars have a larger radius and a higher luminosity at a given age, as a result
These models were computed for solar metallicity and for an equipartition magnetic field strength in the range 2500 < Bfeq < 3000 G. Model effective temperatures were transformed into V−Ks colors using the empirical Teff−(V−Ks) relation from Pecaut & Mamajek (2013) valid for young 5–30 Myr stars. Li abundances were transformed into Li EW, as performed in the case of the Baraffe et al. models.
In the left panel of Fig. 5, we plot the measured Li EW and compare this distribution with the Li EW derived from the Dartmouth et al. models. In this case, no arbitrary color shift is needed to match the hot side of the Li gap. A better match is achieved in the right panel of Fig. 5, when the Li EW are decorrelated from rotation, assuming again that the fast rotators have rotation-unaffected Li abundances.
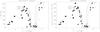 |
Fig. 5 Left panel: distribution of Li EWs versus V−Ks color for β Pic members. Solid lines represent the Li EWs predicted by the Dartmouth models for ages in the range from 20 to 30 Myr. Right panel: same as in the left panel, but Li EW decorrelated from rotation, assuming that fast rotators have rotation-unaffected Li EW. |
The reduced chi-squares2 computed from the fit to the hot boundary of the Li gap have their minimum (see Fig. 6) for an age of 25 ± 3 Myr. The uncertainty formally represents the age interval by which the  increases by one unity from the minimum value. The relatively large values of the indicate either that the EW scatter arising from the intrinsic variability (rotational modulation) is larger than our estimate of 26 mÅ, or the uncertainties associated with the measurements are, in several cases, underestimated at some level.
Our age estimation is in good agreement with respect to the more recent age estimates of 23 ± 4 Myr and 24 ± 3 Myr by Mamajek & Bell (2014) and Bell et al. (2015), respectively, and significantly lower than the Macdonald & Mullan (2010) estimate.
5. Conclusions
We have retrieved from the literature the measured Li EW of 66 members of the young β Pictoris association. We have carried out a photometric monitoring of these members that allowed us to measure, for the first time, the rotation periods of 30 members. For 16 other members we retrieved the rotation periods from Messina et al. (2010, 2011) and, for the remaining members, we used different sources in the literature.
We have explored the existence of a connection between rotation and Li depletion. After removing the mass dependence of the Li EW, using linear fits to EW versus V−Ks, we found that for stars with 0.5 ≤ V−Ks ≤ 3.4 mag, which roughly corresponds to masses M> 0.8 M⊙, no significant correlation is found between Li EW and rotation period. On the contrary, in the color range 3.4 ≤ V−Ks ≤ 4.5 mag, which roughly corresponds to masses 0.3 < M < 0.8 M⊙, we find a strong correlation between the Li EW and the rotation period, where fast rotators are much less Li-depleted than slow rotators. Finally, in the color range 5.4 < V−Ks < 5.9 mag, roughly corresponding to masses M ~ 0.1 M⊙, we have some hint of an inverted correlation, where fast rotators are more depleted than slow rotators. However, this correlation is currently based on only seven stars and the significance level is high (80%), but this is due to just one point that could be an outlier for whatever reason.
Interestingly, the dispersion in the 3.4 ≤ V−Ks ≤ 4.5 mag has a peak-to-peak amplitude that amounts to 180 mÅ, which is about a factor of two larger than that measured in the same mass range in the 5-Myr NGC 2264 open cluster (Bouvier et al. 2016), and about a factor two smaller than that measured in the 125-Myr Pleiades open cluster (Soderblom et al. 1993). Therefore, we note that the effect of rotation on the Li depletion is also age dependent and increases with age.
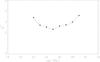 |
Fig. 6 Reduced chi-squares versus age obtained from the residuals from the fit to the hot boundary of the Li-depletion gap. |
A comparison with the Baraffe et al. (2015) models, shows a mismatch of about 0.7 mag in the V−Ks color between the observed and the predicted color range where the Li gap falls. Models predict the Li gap at bluer colors than observed. On the contrary, the Dartmouth models that incorporate the effects of magnetic fields provide a good match with the hot side of the Li depletion gap, although some mismatch on the cool side of the Li gap remains. Comparing the Dartmouth models with the hot side of the Li depletion gap, we infer an age of 25 ± 3 Myr, which is in very good agreement with the most recent age estimates for the β Pictoris association. However, the relatively large values of the reduced chi-squares suggest that either the intrinsic Li EW variability is still underestimated or some other factor, apart from rotation, plays a relevant role in producing the observed scatter among stars with similar mass.
The significance level α represents the probability of observing a value of the correlation coefficient larger than r for a random sample having the same number of observations and degrees of freedom (Bevington 1969).
To compute the we used the uncertainty  where σ0 is the measurement error and σv is the average intrinsic variability.
Acknowledgments
Research on stellar activity at INAF- Catania Astrophysical Observatory is supported by MIUR (Ministero dell’Istruzione, dell’Universitá e della Ricerca). This research has made use of the Simbad database, operated at CDS (Strasbourg, France). S.M. thanks Jerome Bouvier for useful discussion and the anonymous referee for useful comments that helped us to improve this paper.
References
- Balachandran, S. 1995, in The Light Element Abundances (Springer) [Google Scholar]
- Baraffe, I., Homeier, D., Allard, F., & Chabrier, G. 2015, A&A, 577, A42 [NASA ADS] [CrossRef] [EDP Sciences] [Google Scholar]
- Bell, C. P. M., Mamajek, E. E., & Naylor, T. 2015, MNRAS, 454, 593 [NASA ADS] [CrossRef] [Google Scholar]
- Bevington, P. R. 1969, Data reduction and error analysis for the physical sciences (New York: McGraw-Hill) [Google Scholar]
- Binks, A. S., & Jeffries, R. D. 2014, MNRAS, 438, L11 [NASA ADS] [CrossRef] [Google Scholar]
- Bouvier, J., Lanzafame, A. C., Venuti, L., et al. 2016, A&A, 590, A78 [NASA ADS] [CrossRef] [EDP Sciences] [Google Scholar]
- Cutri, R. M., Skrutskie, M. F., van Dyk, S., et al. 2003, 2MASS All Sky Catalog of point sources (NASA/IPAC) [Google Scholar]
- da Silva, L., Torres, C. A. O., de La Reza, R., et al. 2009, A&A, 508, 833 [NASA ADS] [CrossRef] [EDP Sciences] [Google Scholar]
- Desidera, S., Covino, E., Messina, S., et al. 2015, A&A, 573, A126 [NASA ADS] [CrossRef] [EDP Sciences] [Google Scholar]
- Feiden, G. A. 2016, A&A, 593, A99 [NASA ADS] [CrossRef] [EDP Sciences] [Google Scholar]
- Gondoin, P. 2014, A&A, 566, A72 [NASA ADS] [CrossRef] [EDP Sciences] [Google Scholar]
- Hartman, J. D., Bakos, G. Á., Kovács, G., & Noyes, R. W. 2010, MNRAS, 408, 475 [NASA ADS] [CrossRef] [Google Scholar]
- Kiss, L. L., Moór, A., Szalai, T., et al. 2011, MNRAS, 411, 117 [NASA ADS] [CrossRef] [Google Scholar]
- Lépine, S., & Simon, M. 2009, AJ, 137, 3632 [NASA ADS] [CrossRef] [Google Scholar]
- Macdonald, J., & Mullan, D. J. 2010, ApJ, 723, 1599 [NASA ADS] [CrossRef] [Google Scholar]
- Malo, L., Doyon, R., Lafrenière, D., et al. 2013, ApJ, 762, 88 [NASA ADS] [CrossRef] [Google Scholar]
- Malo, L., Artigau, É., Doyon, R., et al. 2014a, ApJ, 788, 81 [NASA ADS] [CrossRef] [Google Scholar]
- Malo, L., Doyon, R., Feiden, G. A., et al. 2014b, ApJ, 792, 37 [NASA ADS] [CrossRef] [Google Scholar]
- Mamajek, E. E., & Bell, C. P. M. 2014, MNRAS, 445, 2169 [NASA ADS] [CrossRef] [Google Scholar]
- Mann, A. W., Newton, E. R., Rizzuto, A. C., et al. 2016, AJ, 152, 61 [NASA ADS] [CrossRef] [Google Scholar]
- Mentuch, E., Brandeker, A., van Kerkwijk, M. H., Jayawardhana, R., & Hauschildt, P. H. 2008, ApJ, 689, 1127 [NASA ADS] [CrossRef] [Google Scholar]
- Messina, S., Desidera, S., Turatto, M., Lanzafame, A. C., & Guinan, E. F. 2010, A&A, 520, A15 [NASA ADS] [CrossRef] [EDP Sciences] [Google Scholar]
- Messina, S., Desidera, S., Lanzafame, A. C., Turatto, M., & Guinan, E. F. 2011, A&A, 532, A10 [NASA ADS] [CrossRef] [EDP Sciences] [Google Scholar]
- Messina, S., Millward, M., Buccino, A., et al. 2016, A&A, in press (Paper I) DOI: 10.1051/0004-6361/201629152 [Google Scholar]
- Moór, A., Szabó, G. M., Kiss, L. L., et al. 2013, MNRAS, 435, 1376 [NASA ADS] [CrossRef] [Google Scholar]
- Pecaut, M. J., & Mamajek, E. E. 2013, ApJS, 208, 9 [NASA ADS] [CrossRef] [Google Scholar]
- Pojmanski, G. 2002, Acta Astron., 52, 397 [NASA ADS] [Google Scholar]
- Reid, I. N., Kirkpatrick, J. D., Liebert, J., et al. 2002, AJ, 124, 519 [NASA ADS] [CrossRef] [Google Scholar]
- Schlieder, J. E., Lépine, S., & Simon, M. 2010, AJ, 140, 119 [NASA ADS] [CrossRef] [Google Scholar]
- Schlieder, J. E., Lépine, S., & Simon, M. 2012, AJ, 143, 80 [NASA ADS] [CrossRef] [Google Scholar]
- Shkolnik, E. L., Anglada-Escudé, G., Liu, M. C., et al. 2012, ApJ, 758, 56 [NASA ADS] [CrossRef] [Google Scholar]
- Soderblom, D. R., Jones, B. F., Balachandran, S., et al. 1993, AJ, 106, 1059 [NASA ADS] [CrossRef] [Google Scholar]
- Spearman, C. 1904, Am. J. Psychol., 15, 72 [Google Scholar]
- Torres, C. A. O., Quast, G. R., da Silva, L., et al. 2006, A&A, 460, 695 [NASA ADS] [CrossRef] [EDP Sciences] [Google Scholar]
- Zapatero Osorio, M. R., Béjar, V. J. S., Pavlenko, Y., et al. 2002, A&A, 384, 937 [NASA ADS] [CrossRef] [EDP Sciences] [Google Scholar]
- Zuckerman, B., & Song, I. 2004, ARA&A, 42, 685 [NASA ADS] [CrossRef] [MathSciNet] [Google Scholar]
Appendix A: Additional table
Properties of the 66 members of the β Pictoris association studied in this work.
All Tables
Properties of the 66 members of the β Pictoris association studied in this work.
All Figures
|
Fig. 1 Distribution of Li EW versus V−Ks color for 66 members of the β Pictoris association. The meaning of symbols is given in the legend. Dotted vertical lines indicate the range of values for stars with multiple Li EW measurements. All circled symbols indicate stars hosting debris discs. |
| In the text | |
|
Fig. 2 Top panel: distribution of Li EW versus V−Ks color in three color ranges: 0.5 < V−Ks < 3.4 mag (19 stars), 3.4 < V−Ks < 4.5 mag (21 stars), and 5.4 < V−Ks < 5.9 mag (6 stars) of β Pictoris members with known rotation period and with overplotted (solid lines) the linear fits. Middle panel: residuals from the fit with horizontal dotted lines indicating the amplitude of dispersion. Bottom panels: distribution of Li EW residuals versus rotation period in the three color ranges. Solid lines are linear fits, r is the Pearson linear correlation coefficient and α the significance level. |
| In the text | |
|
Fig. 3 Left panel: distribution of Li EWs versus V−Ks color for β Pic members. Solid lines represent the Li EWs predicted by the models of Baraffe et al. (2015) for ages in the range from 5 to 25 Myr. Right panel: same as in the left panel, but with models arbitrarily shifted by 0.7 mag towards redder colors to match the observations. |
| In the text | |
|
Fig. 4 Absolute magnitude versus V−Ks color of members in the Li gap. Solid lines represent the isochrones corresponding to ages from 5 (top) to 25 Myr (bottom). |
| In the text | |
|
Fig. 5 Left panel: distribution of Li EWs versus V−Ks color for β Pic members. Solid lines represent the Li EWs predicted by the Dartmouth models for ages in the range from 20 to 30 Myr. Right panel: same as in the left panel, but Li EW decorrelated from rotation, assuming that fast rotators have rotation-unaffected Li EW. |
| In the text | |
|
Fig. 6 Reduced chi-squares versus age obtained from the residuals from the fit to the hot boundary of the Li-depletion gap. |
| In the text | |
Current usage metrics show cumulative count of Article Views (full-text article views including HTML views, PDF and ePub downloads, according to the available data) and Abstracts Views on Vision4Press platform.
Data correspond to usage on the plateform after 2015. The current usage metrics is available 48-96 hours after online publication and is updated daily on week days.
Initial download of the metrics may take a while.