Free Access
Fig. 4
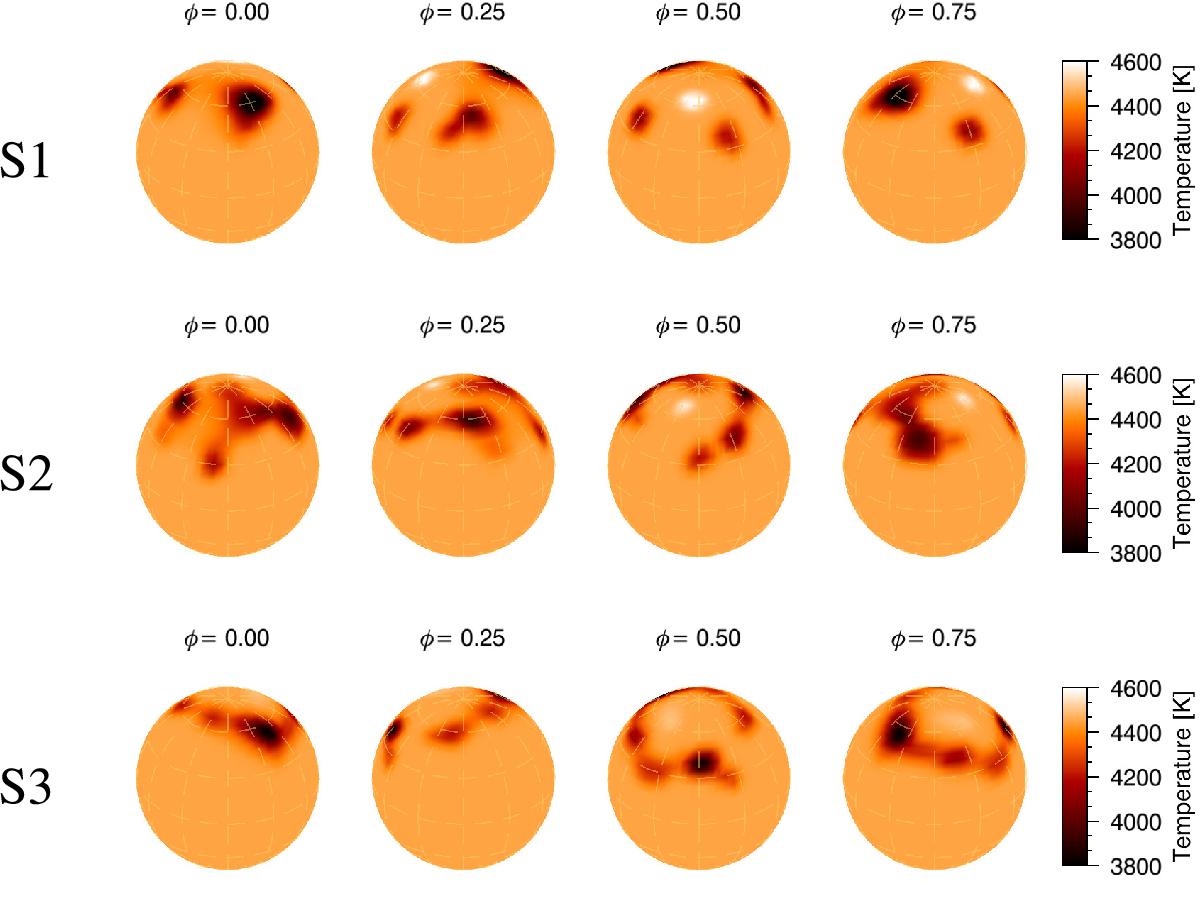
Doppler images of KU Peg for the three data sets S1, S2, and S3 in 2006. The corresponding time stamps in mid-dates are 2006.61, 2006.67, and 2006.76, respectively. The maps are shown in four spherical projections with the corresponding temperature scale. The rotational phase is indicated above each image.
Current usage metrics show cumulative count of Article Views (full-text article views including HTML views, PDF and ePub downloads, according to the available data) and Abstracts Views on Vision4Press platform.
Data correspond to usage on the plateform after 2015. The current usage metrics is available 48-96 hours after online publication and is updated daily on week days.
Initial download of the metrics may take a while.