Fig. 2
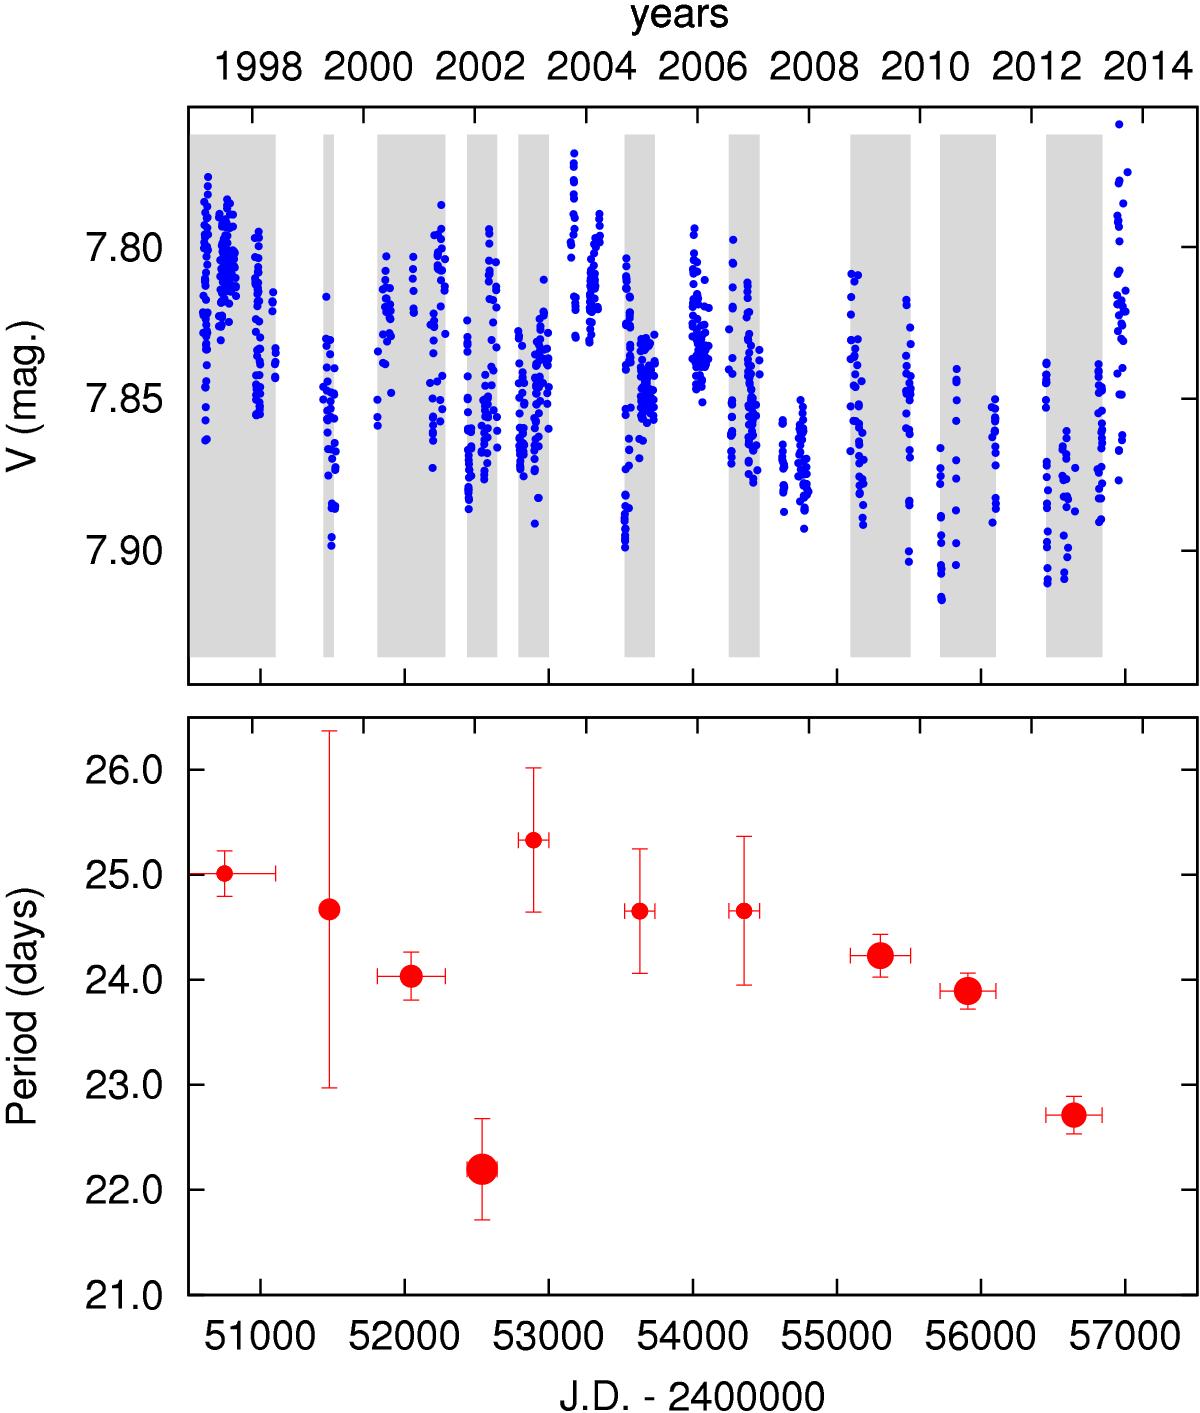
Johnson V observations (top) and seasonally derived photometric periods (bottom) of KU Peg. Each grey band indicates the time range of the data combined for the period determination in the lower panel. In the bottom panel the size of each dot is proportional to the amplitude of the frequency peak in the power spectrum; the vertical error bar represents the uncertainty of the period determination. The horizontal bar indicates the time coverage.
Current usage metrics show cumulative count of Article Views (full-text article views including HTML views, PDF and ePub downloads, according to the available data) and Abstracts Views on Vision4Press platform.
Data correspond to usage on the plateform after 2015. The current usage metrics is available 48-96 hours after online publication and is updated daily on week days.
Initial download of the metrics may take a while.