Fig. 10
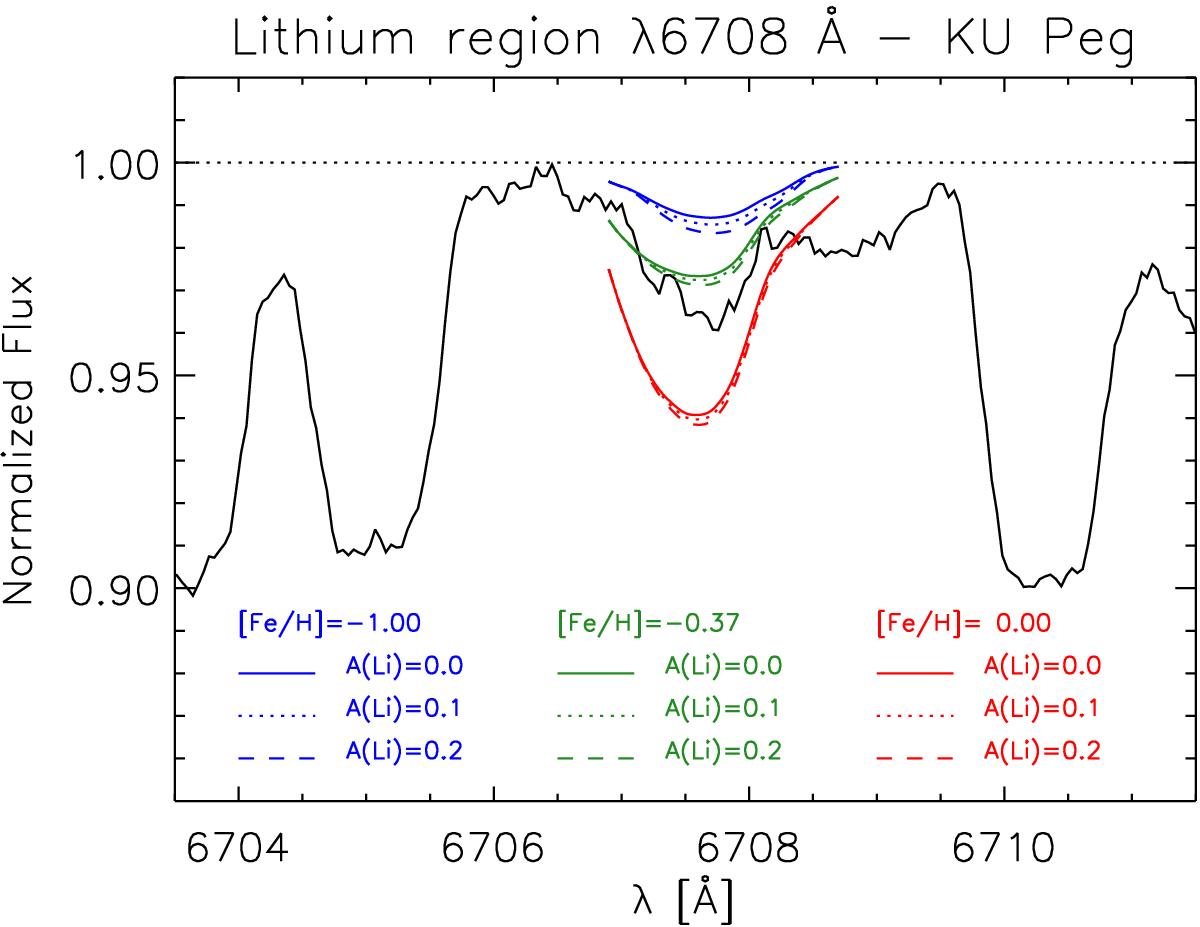
Li i 6708 Å spectral region of KU Peg. The observed spectrum is an average of 40 individual exposures taken in July/Aug 2009. The three sets of thin lines are synthetic spectra for three metallicities (see insert, for –1.00, –0.37 and 0.0) and for three Li abundances of log n = 0.0, 0.1, and 0.2. Our best estimate with a metallicity of –0.37 suggests an upper Li limit of log n = 0.1 ± 0.1.
Current usage metrics show cumulative count of Article Views (full-text article views including HTML views, PDF and ePub downloads, according to the available data) and Abstracts Views on Vision4Press platform.
Data correspond to usage on the plateform after 2015. The current usage metrics is available 48-96 hours after online publication and is updated daily on week days.
Initial download of the metrics may take a while.