Fig. 7
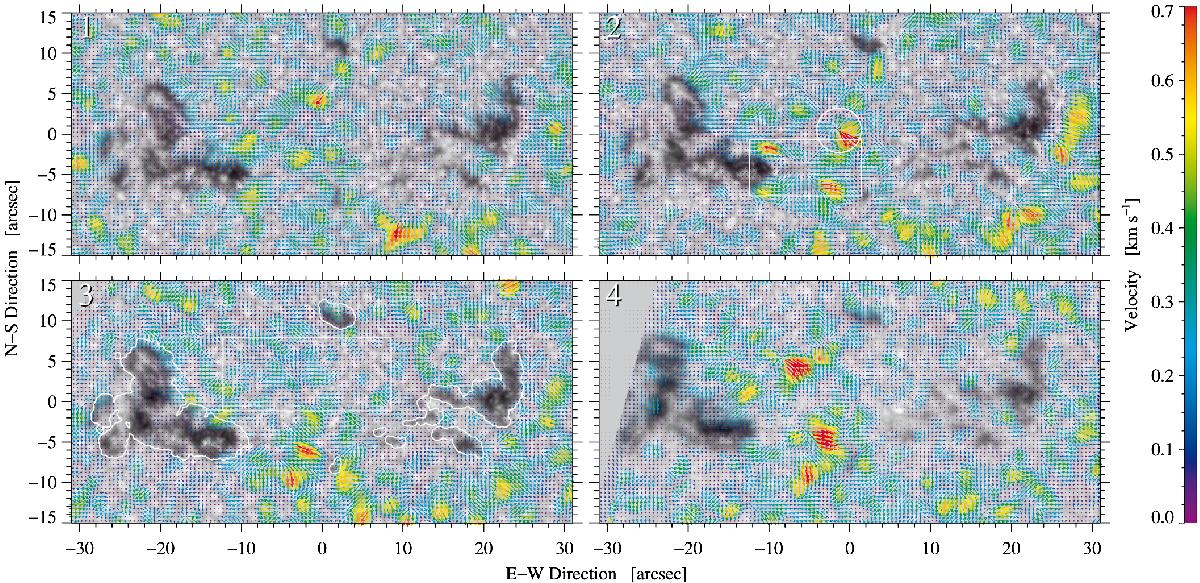
Horizontal flow field around active region NOAA 12118 computed using GREGOR blue continuum images. Color-coded vectors (best seen when zooming in the on-line version and red indicates a flow speed in excess of 0.7 km s-1) are superposed onto the first image of the respective time-series. The region is rotated for better display such that its longest axis is horizontal. The white circle in panel (2) indicates a large, elongated, rapidly expanding granule (see Fig. 9). The white rectangle in panel (2) marks the diverging feature present in all panels but it is strongest in panel (2). The white contour lines and rectangle in panel (3) refer to the regions that are used to characterize the horizontal flow speed for various features (see Fig. 8 and Table 3).
Current usage metrics show cumulative count of Article Views (full-text article views including HTML views, PDF and ePub downloads, according to the available data) and Abstracts Views on Vision4Press platform.
Data correspond to usage on the plateform after 2015. The current usage metrics is available 48-96 hours after online publication and is updated daily on week days.
Initial download of the metrics may take a while.