Free Access
Fig. 5
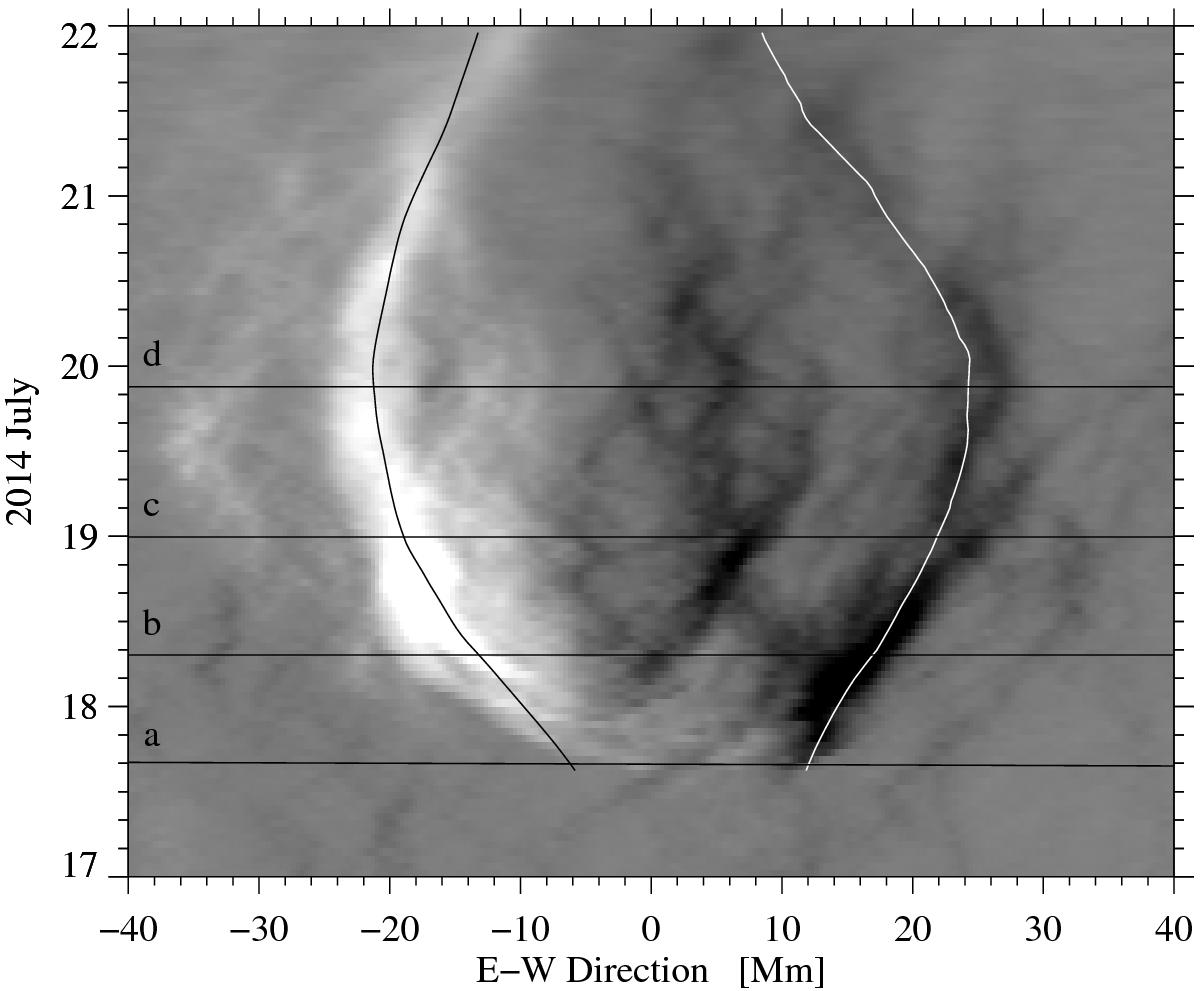
Space-time diagram collating five days (July 17−21) of HMI magnetograms. The magnetic field strength is scaled between ± 100 G. The white and black curves trace the location of the extrema of negative and positive polarities over five days. The black horizontal lines indicate the four stages discussed in Sect. 3.2
Current usage metrics show cumulative count of Article Views (full-text article views including HTML views, PDF and ePub downloads, according to the available data) and Abstracts Views on Vision4Press platform.
Data correspond to usage on the plateform after 2015. The current usage metrics is available 48-96 hours after online publication and is updated daily on week days.
Initial download of the metrics may take a while.