Fig. 9
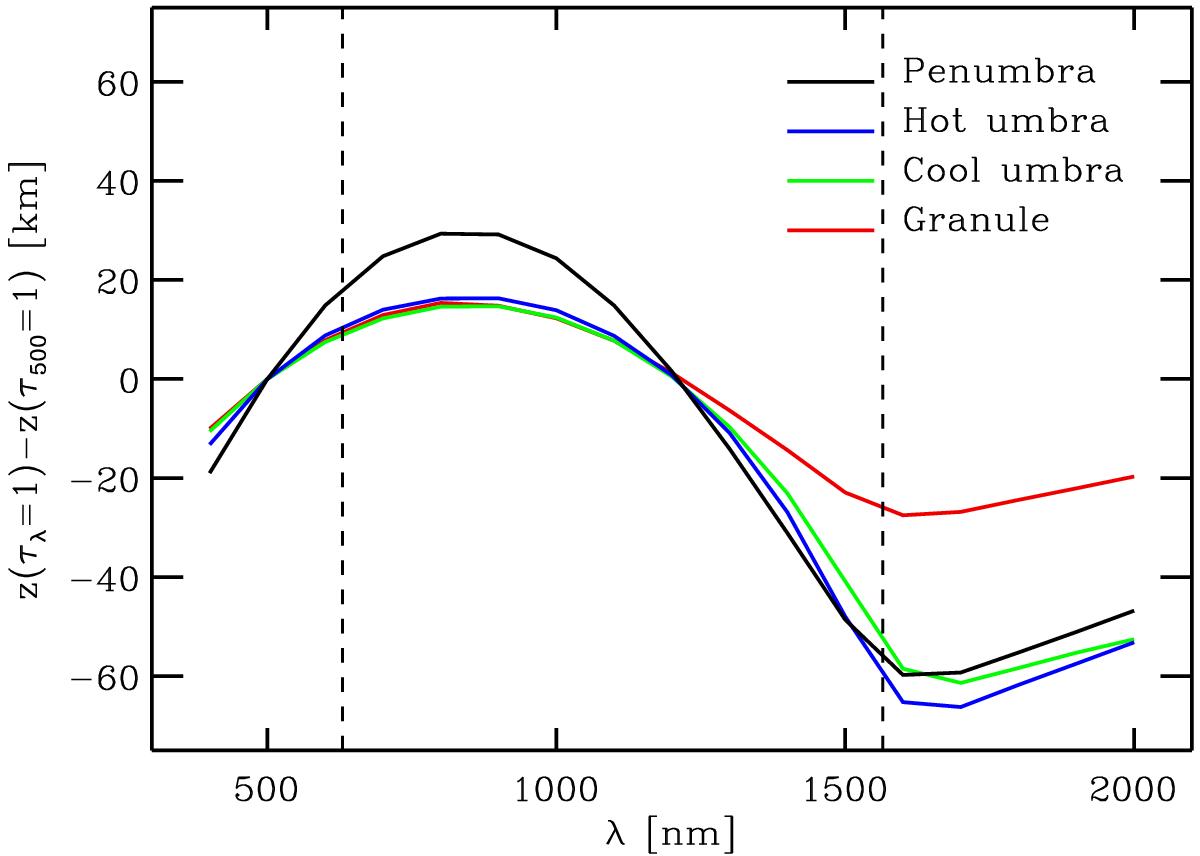
Height at which the continuum level z(τλ = 1) is formed, with respect to the height at a wavelength of 500 nm as a function of wavelength. The color curves indicate the different models: red (granular model), blue (hot-small umbral model), green (cool-large umbral model), and black (penumbral model). The two vertical dashed lines are located at λ = 630 nm and λ = 1565 nm.
Current usage metrics show cumulative count of Article Views (full-text article views including HTML views, PDF and ePub downloads, according to the available data) and Abstracts Views on Vision4Press platform.
Data correspond to usage on the plateform after 2015. The current usage metrics is available 48-96 hours after online publication and is updated daily on week days.
Initial download of the metrics may take a while.